You said, we did
Improving our services based on your feedback
April - December 2025


Overall satisfaction


Between April and December 2025, we carried out 925 phone surveys with our customers* through our research partner IFF and the results are in.
(*These include Shared Ownership customers, which are not submitted to the Regulator)
Results from the TSM survey indicate that 79% of respondents are satisfied with the overall services we provide, an increase of 3.2% compared to last year.

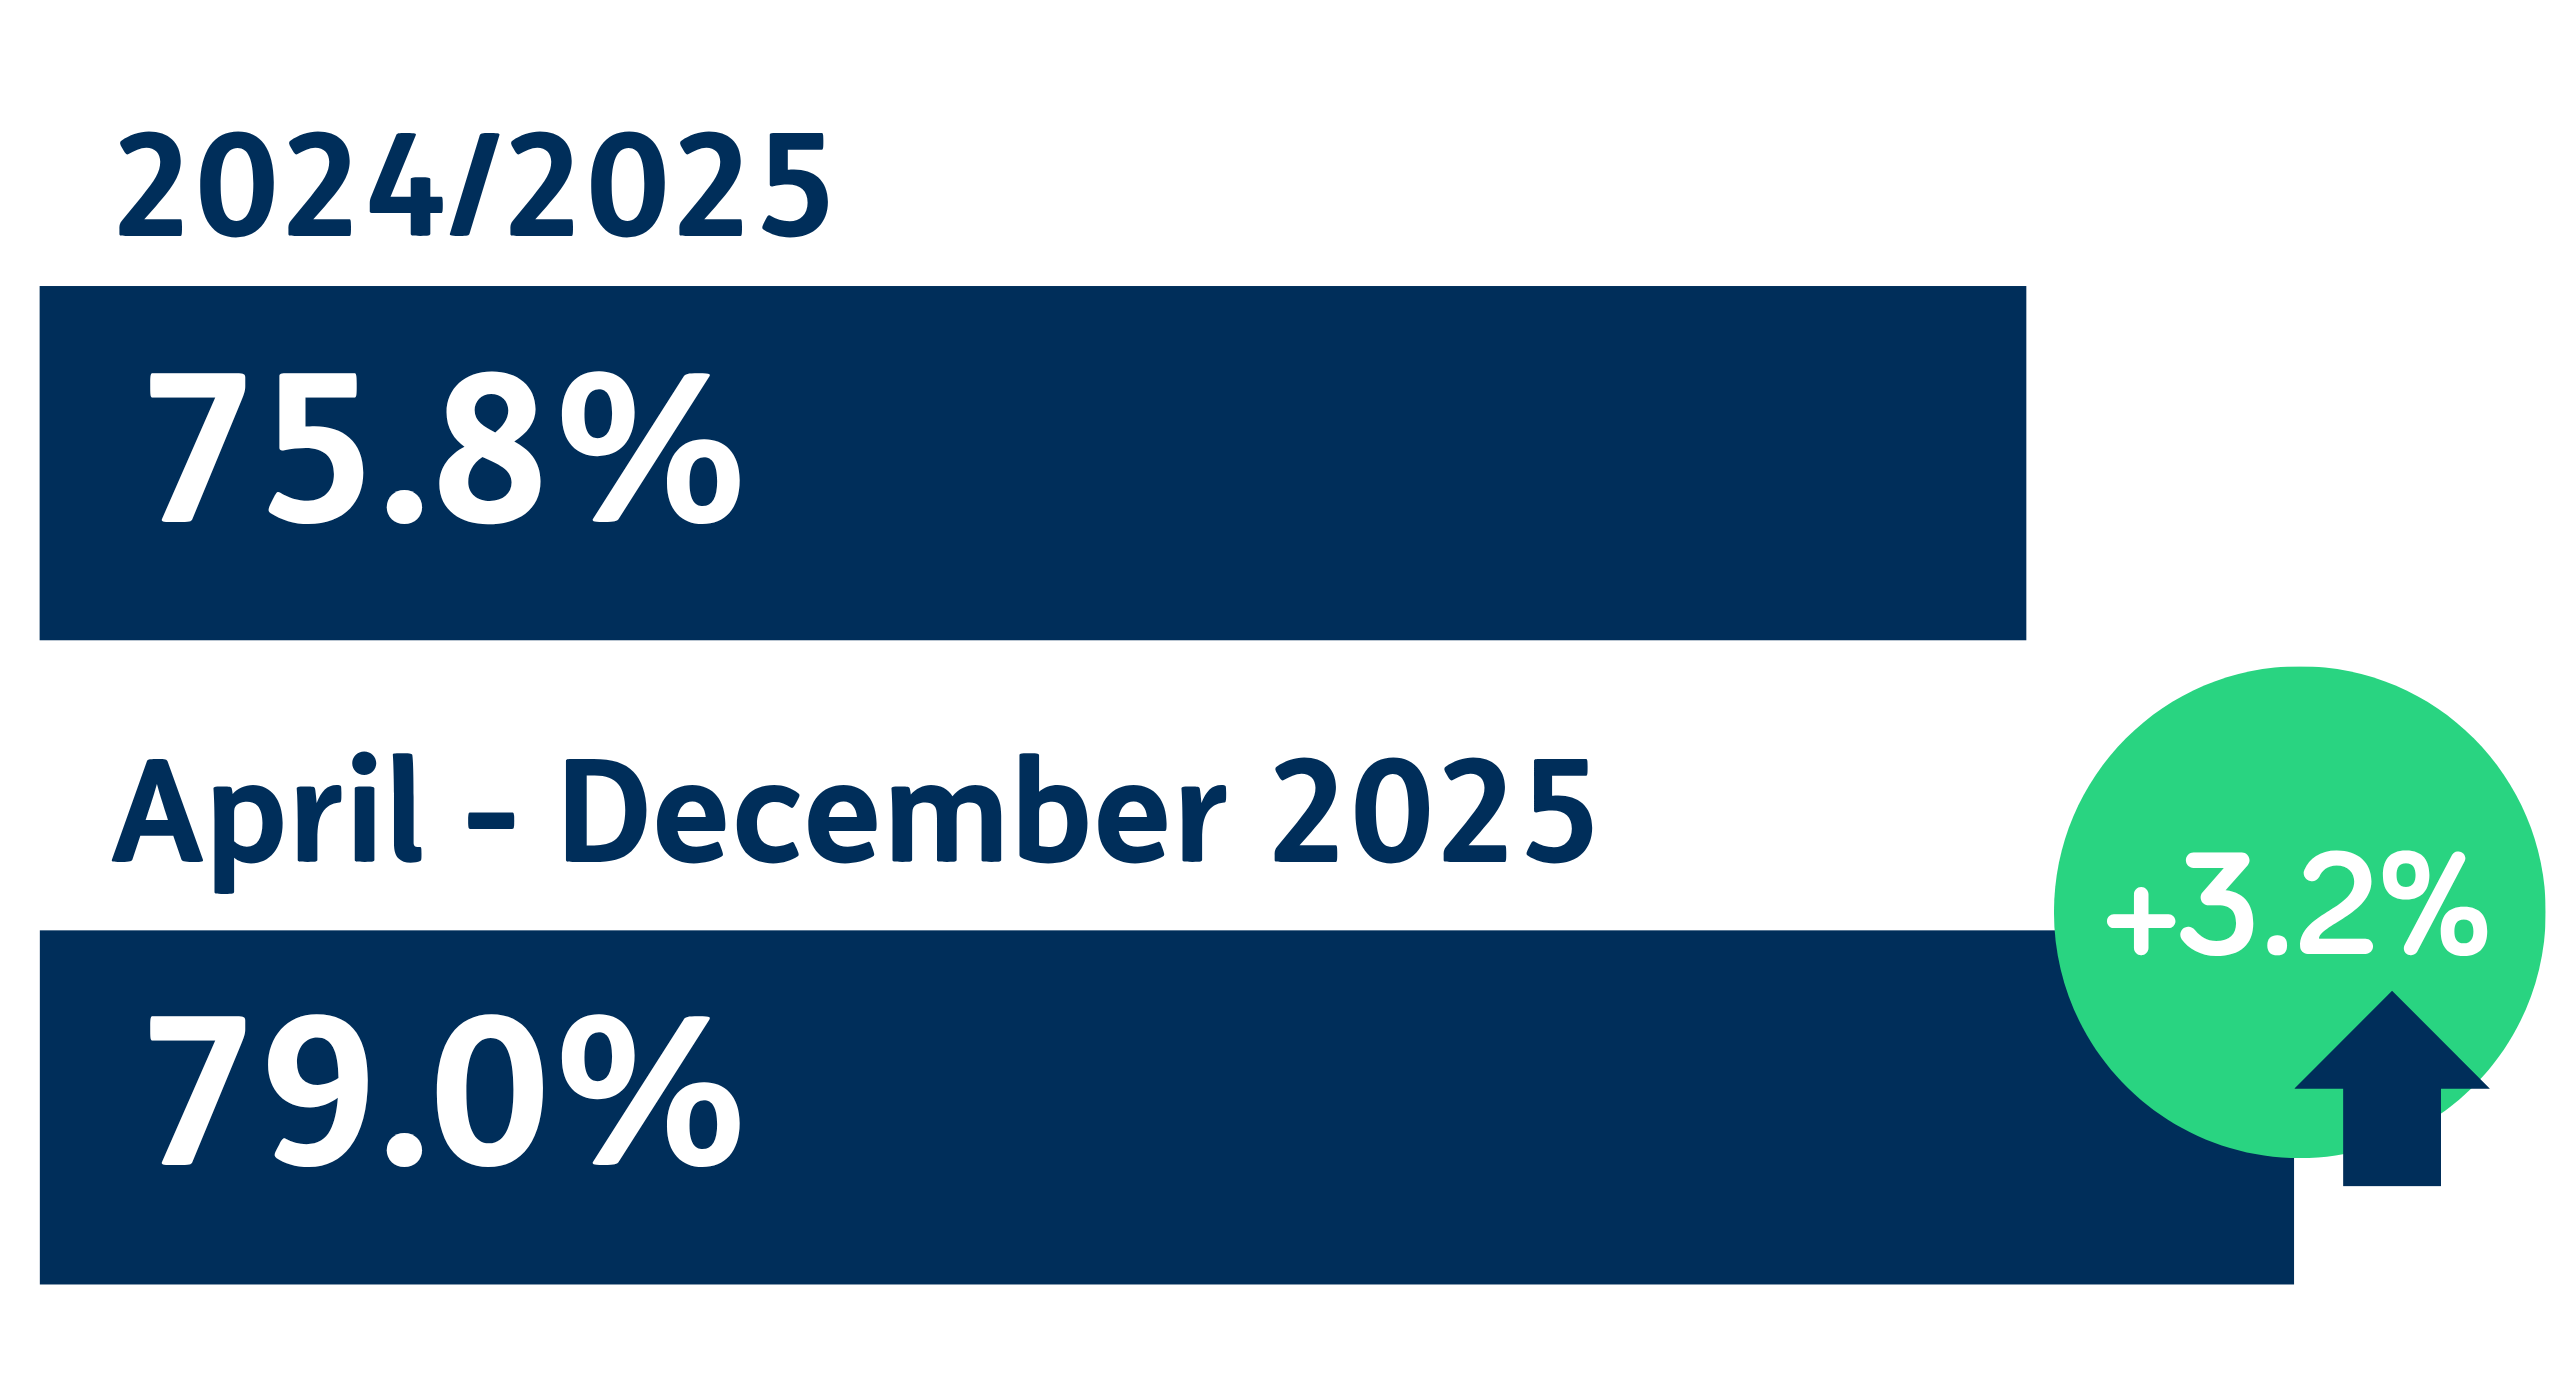
The median satisfaction for Private Registered Providers is 75.4%. We're happy to report we are above the sector average for overall satisfaction.
We have included 24/25 median figures for Private Registered Providers, reported by the regulator, throughout this report so customers can clearly see how our performance compares to landlords across the wider sector.
What we're doing well:
Overall, performance has been maintained or improved across all Tenant Satisfaction Measures (TSMs) compared to 2024/25 results. The most significant improvement is in non-emergency repairs completed within timescales, which has increased by 9% to 92.5%.
Customer feedback remains consistently positive, with many customers complimenting whg’s overall services. In particular, they highlight:
- Helpfulness and professionalism of staff.
- Responsiveness of teams.
- Quality of the repairs service.
A significant number of customers have also stated that they have no issues to report, reflecting continued satisfaction with the service provided.
Areas for improvements:
Some customers reported dissatisfaction with:
- Repair timescales and quality.
- The condition of their homes, including the age of windows, roofs and kitchens.
- The condition of communal areas.

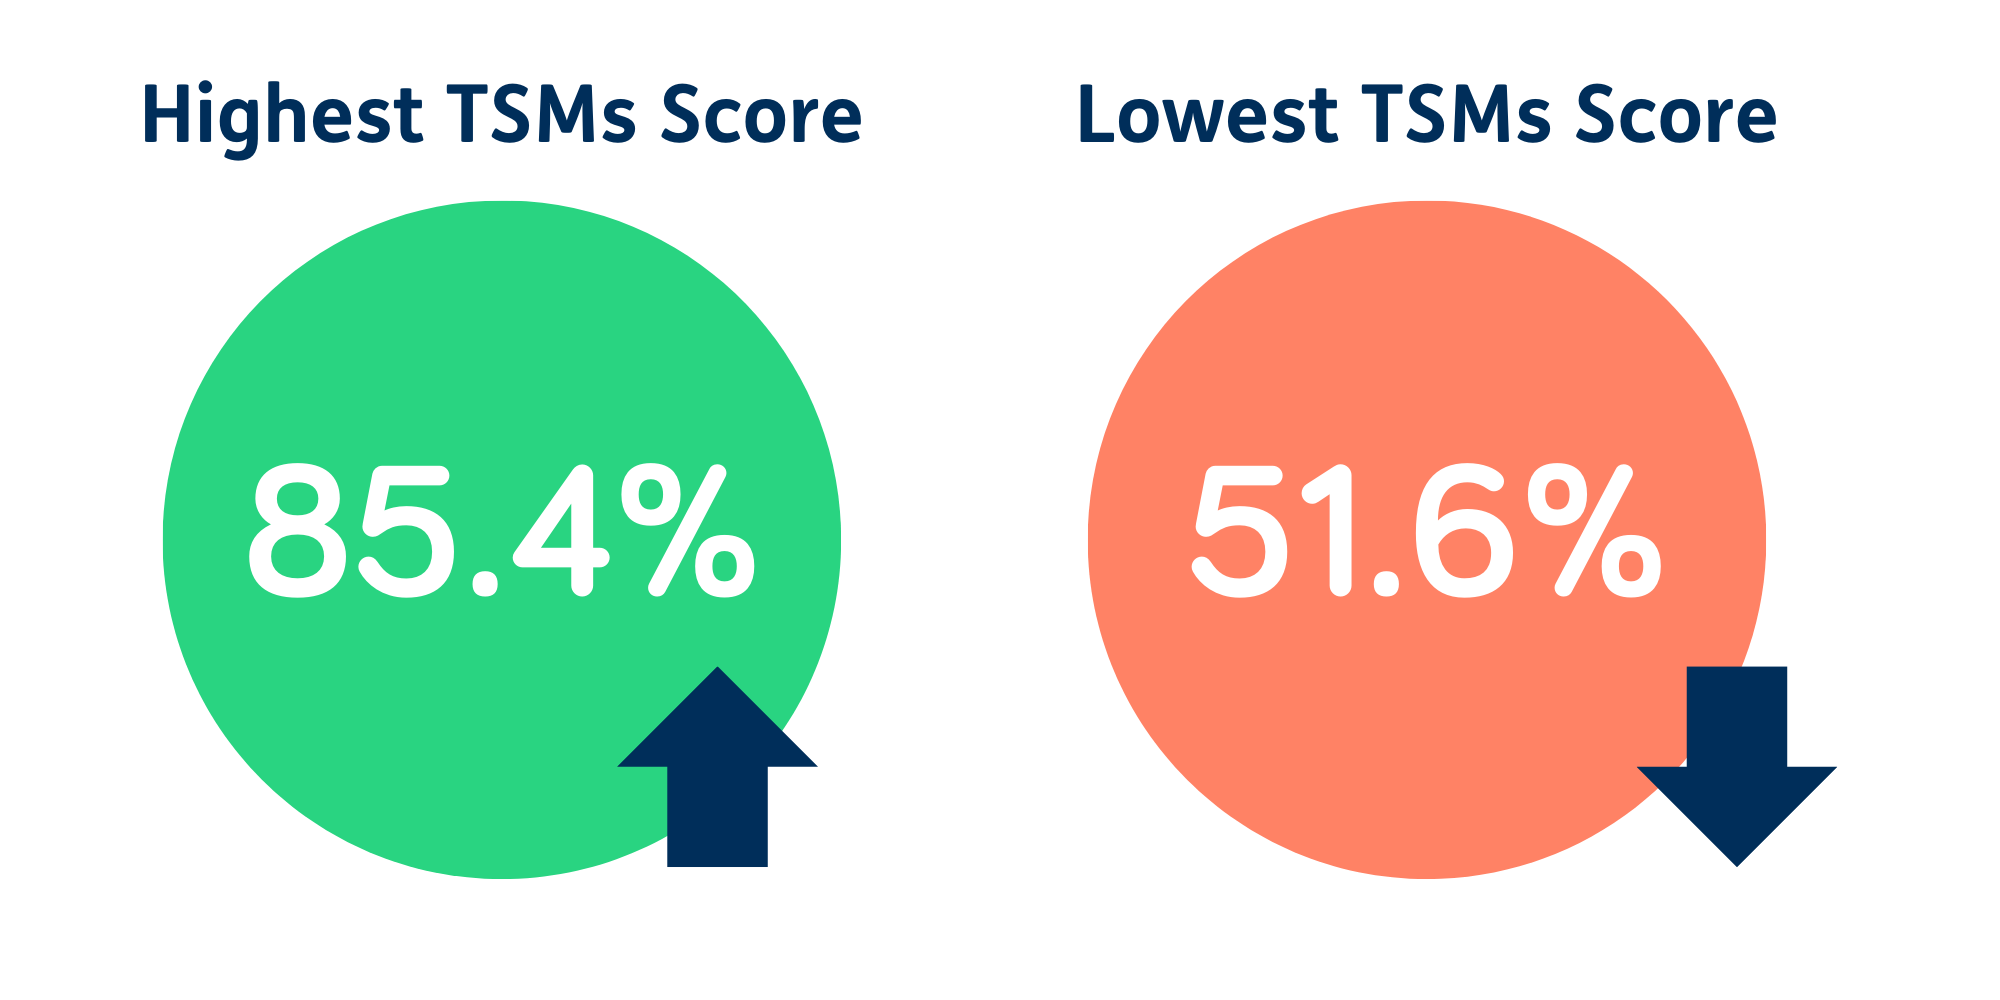
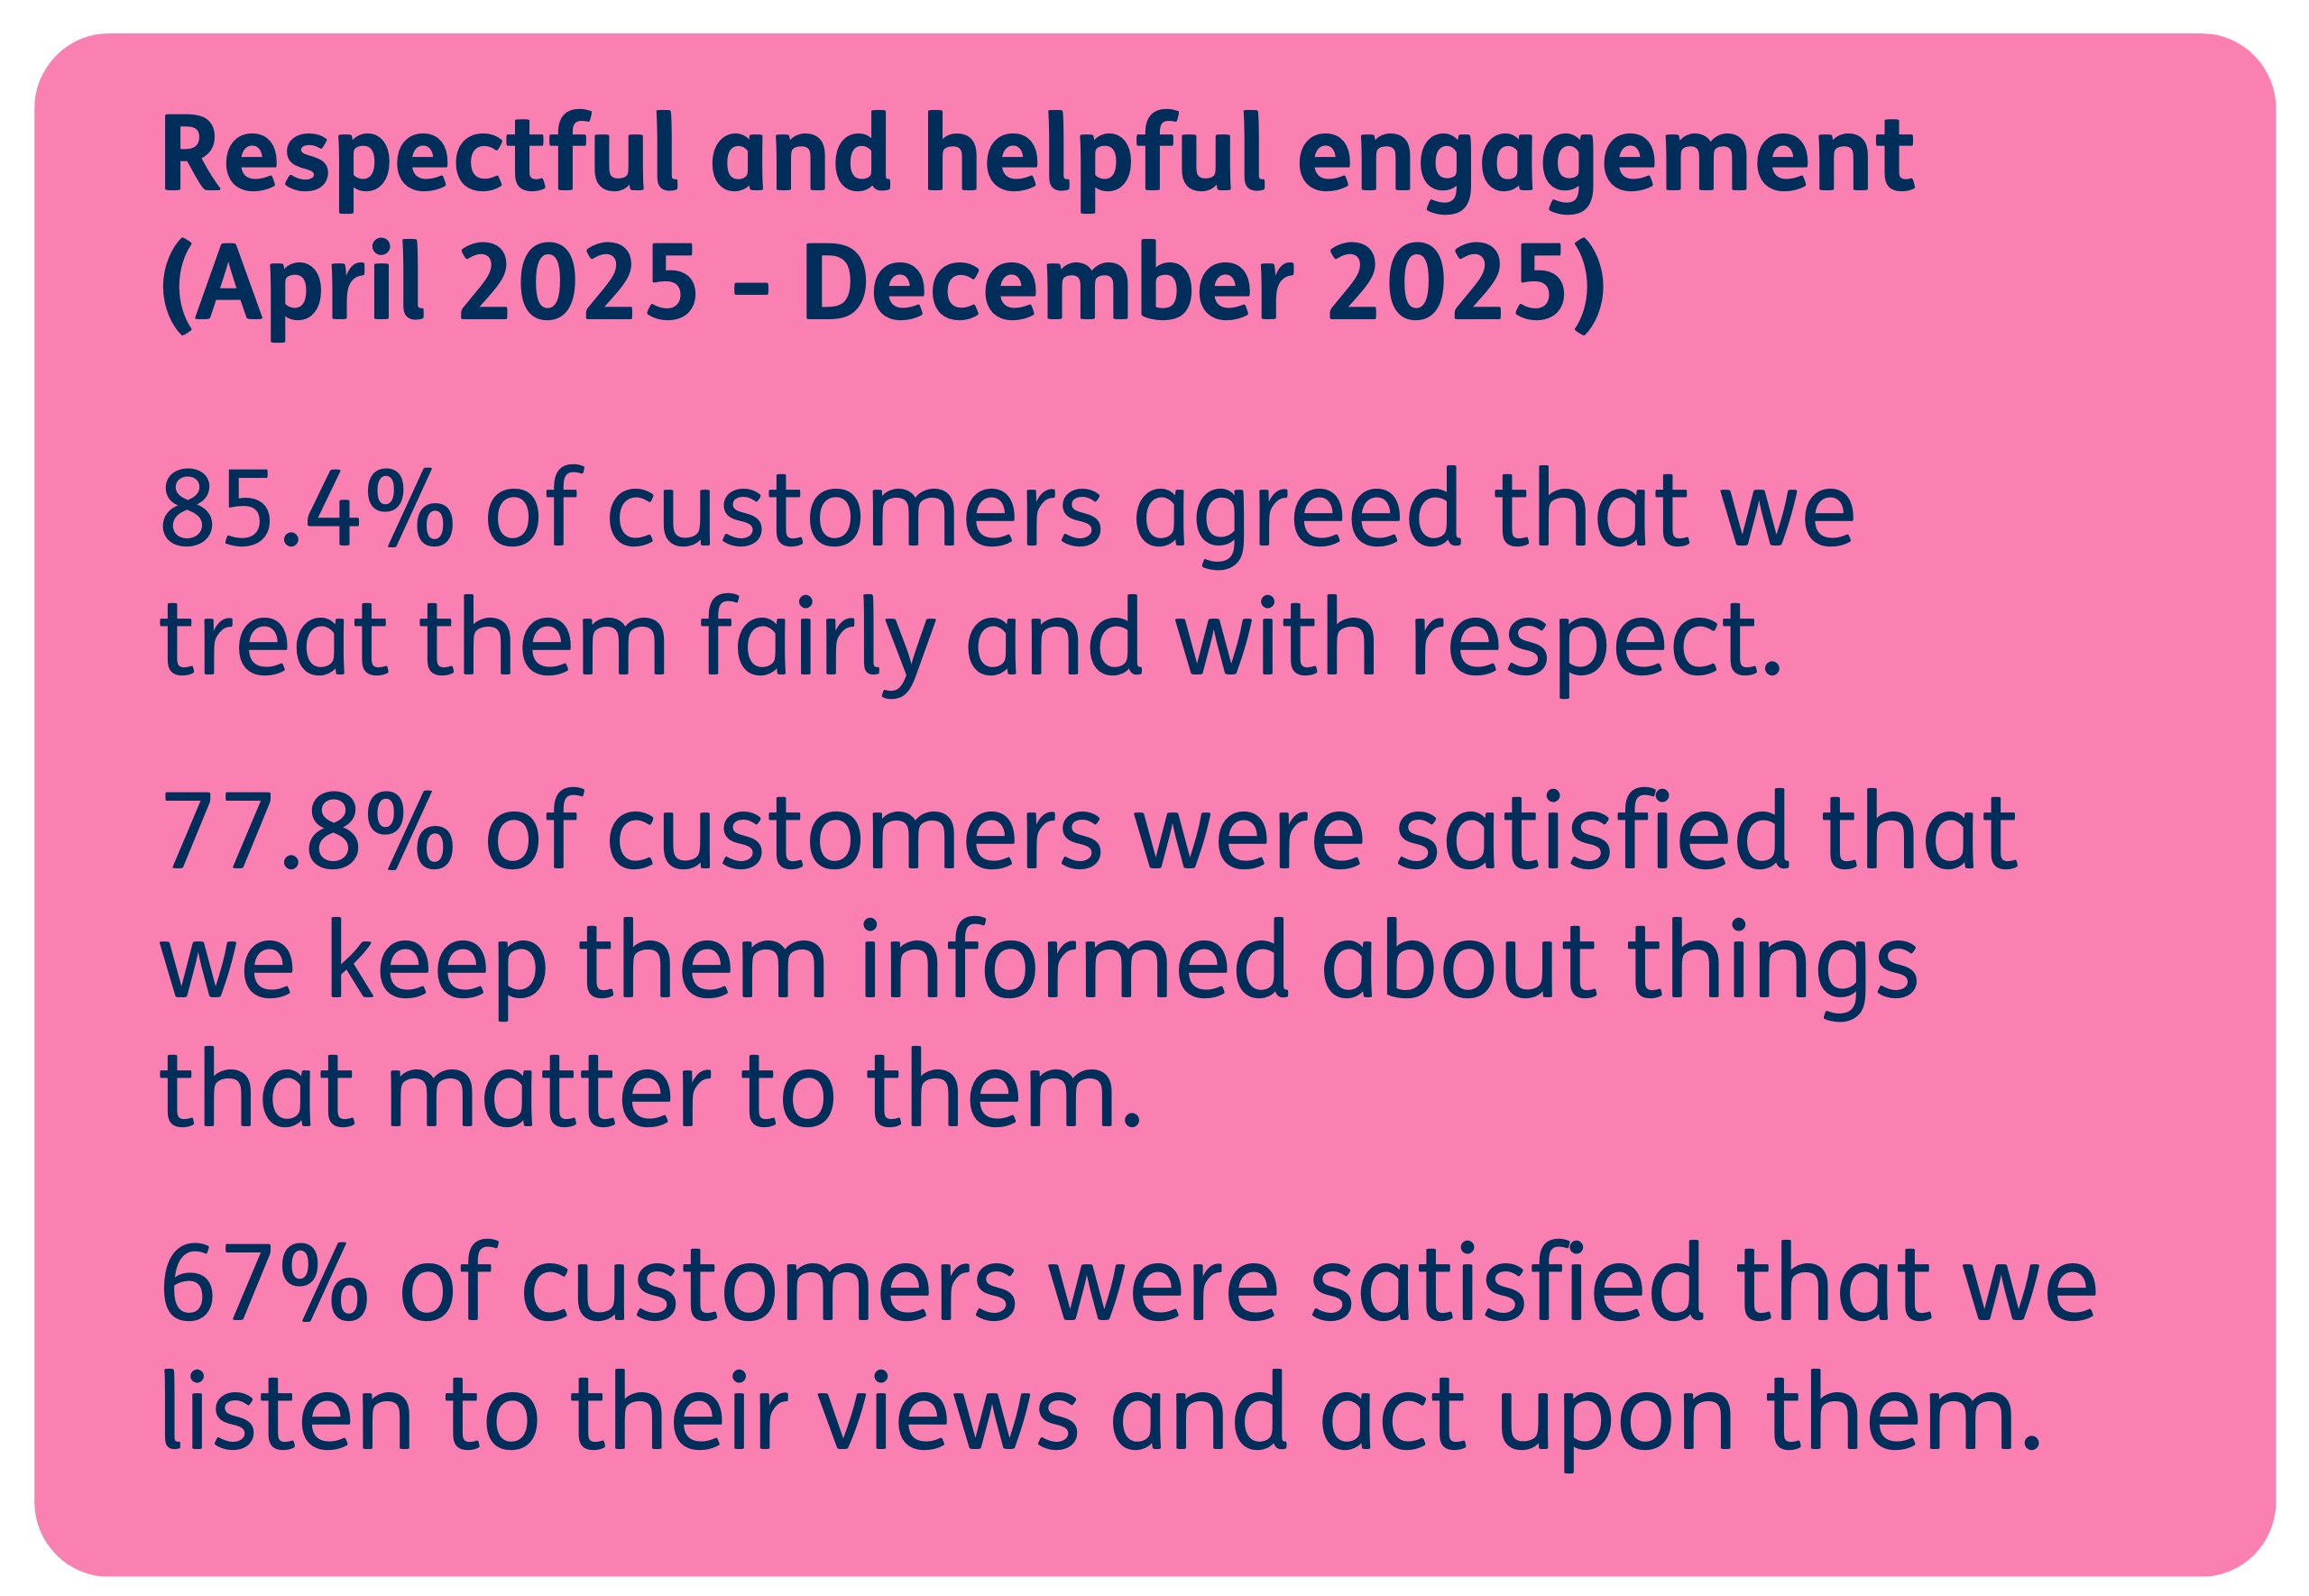
Our highest score was for treating customers fairly and with respect, at 85.4%.
Our lowest score was satisfaction with complaint handling. However, in response to your feedback we have focused on improving this service and satisfaction has gone up this year to 51.6%, a 17% increase on last year. We’ll continue to work on making things better.
We are working hard to address these issues and improve our service to you. We know we don’t always get things right and when that happens we want to sort it out.
Thank you for your ongoing feedback which continues to help us reshape our services.
Keeping properties in good repair


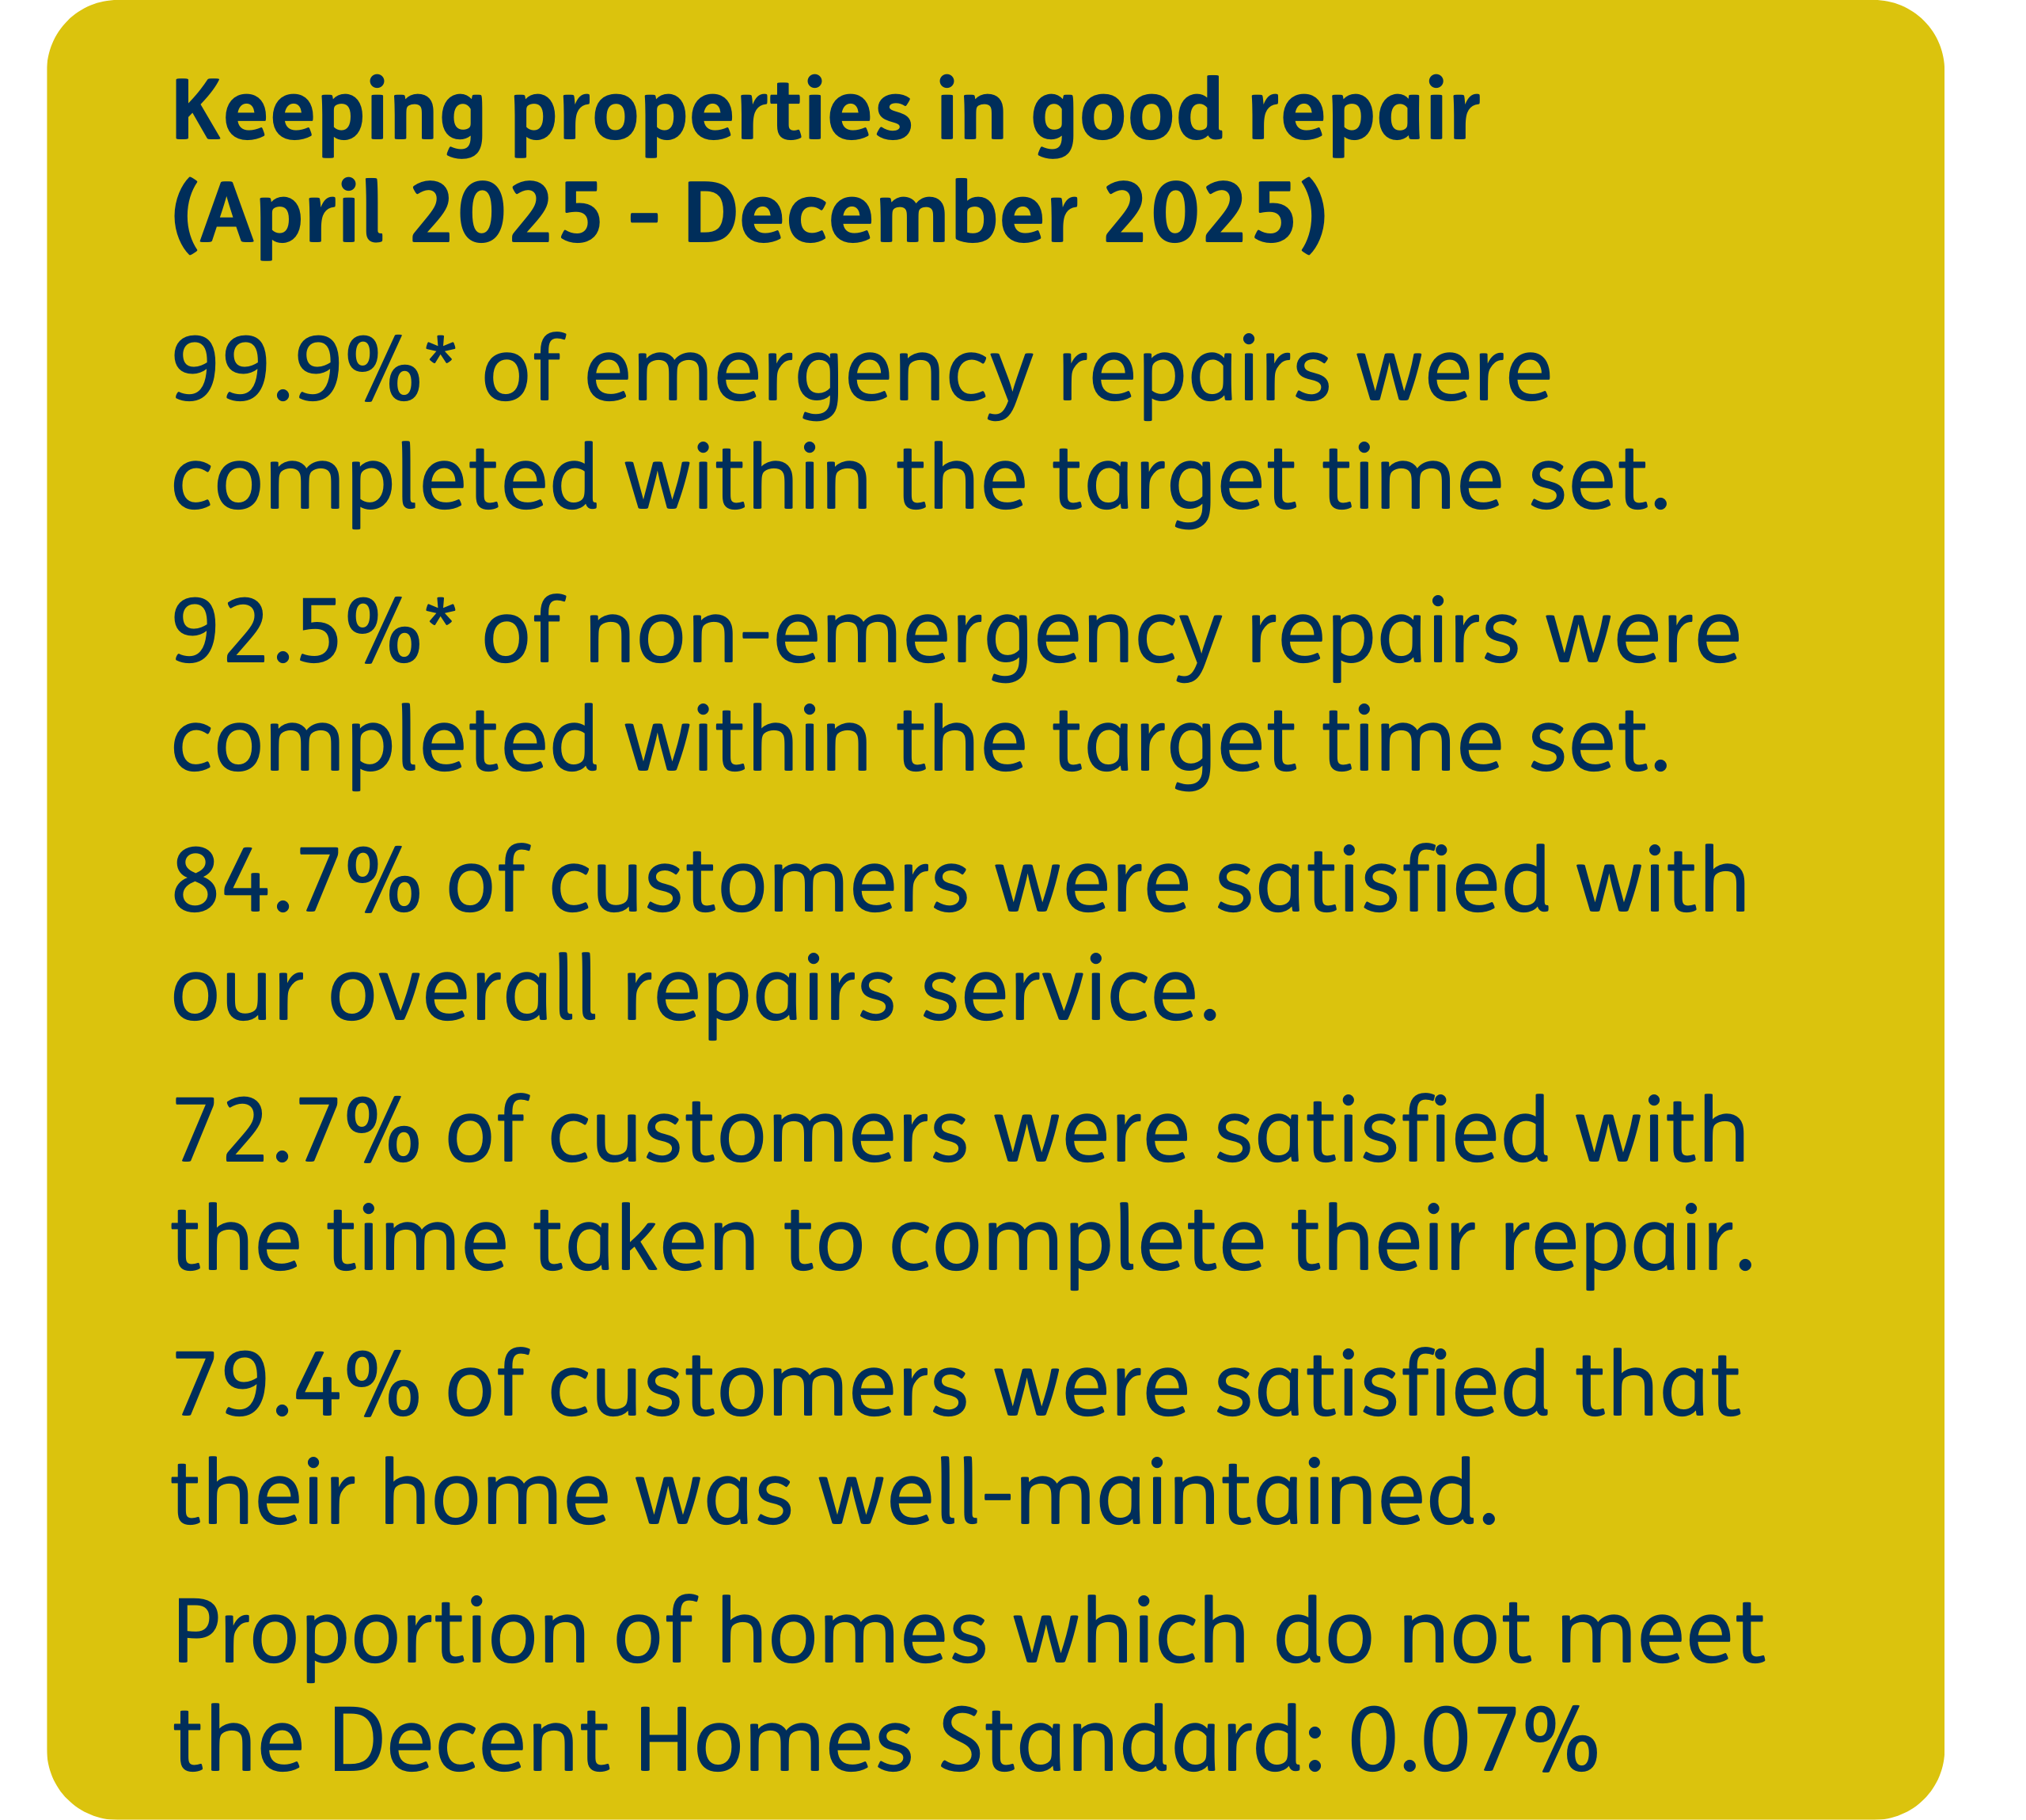
*Target timescales for repairs: Emergency: 24 hours, Urgent: 3 working days, Routine: 32 working days (45 calendar days), Programmed 65 working days (90 calendar days)
24/25 medians for Private Registered Providers reported by the regulator
You said: You told us that too many repairs were taking too long, appointments were sometimes late or cancelled without clear communication, and issues like leaks, damp and mould, and outstanding repairs weren’t always being completed first time.
We did:
Put complaints front and centre – Our repairs team leaders now take clearer ownership of complaints from start to finish, so issues are followed up properly and resolved sooner.
Focused on the longest-waiting repairs – We’ve introduced a new approach to prioritise and reduce our oldest outstanding repairs, so customers aren’t left waiting.
Improved how we manage appointments and work – We’re using a new performance scorecard to track how repairs are delivered and spot problems earlier. We’ve also replaced 235 of our vans so we can provide a faster and more efficient service with minimal disruptions.
Strengthened checks after repairs – We’ve improved our record-keeping and post-repair inspections to make sure work is completed properly, especially for issues like leaks and damp.


"We were wary about housing associations due to a really bad experience, but whg so far has been great, really helpful, and repairs are done fast."
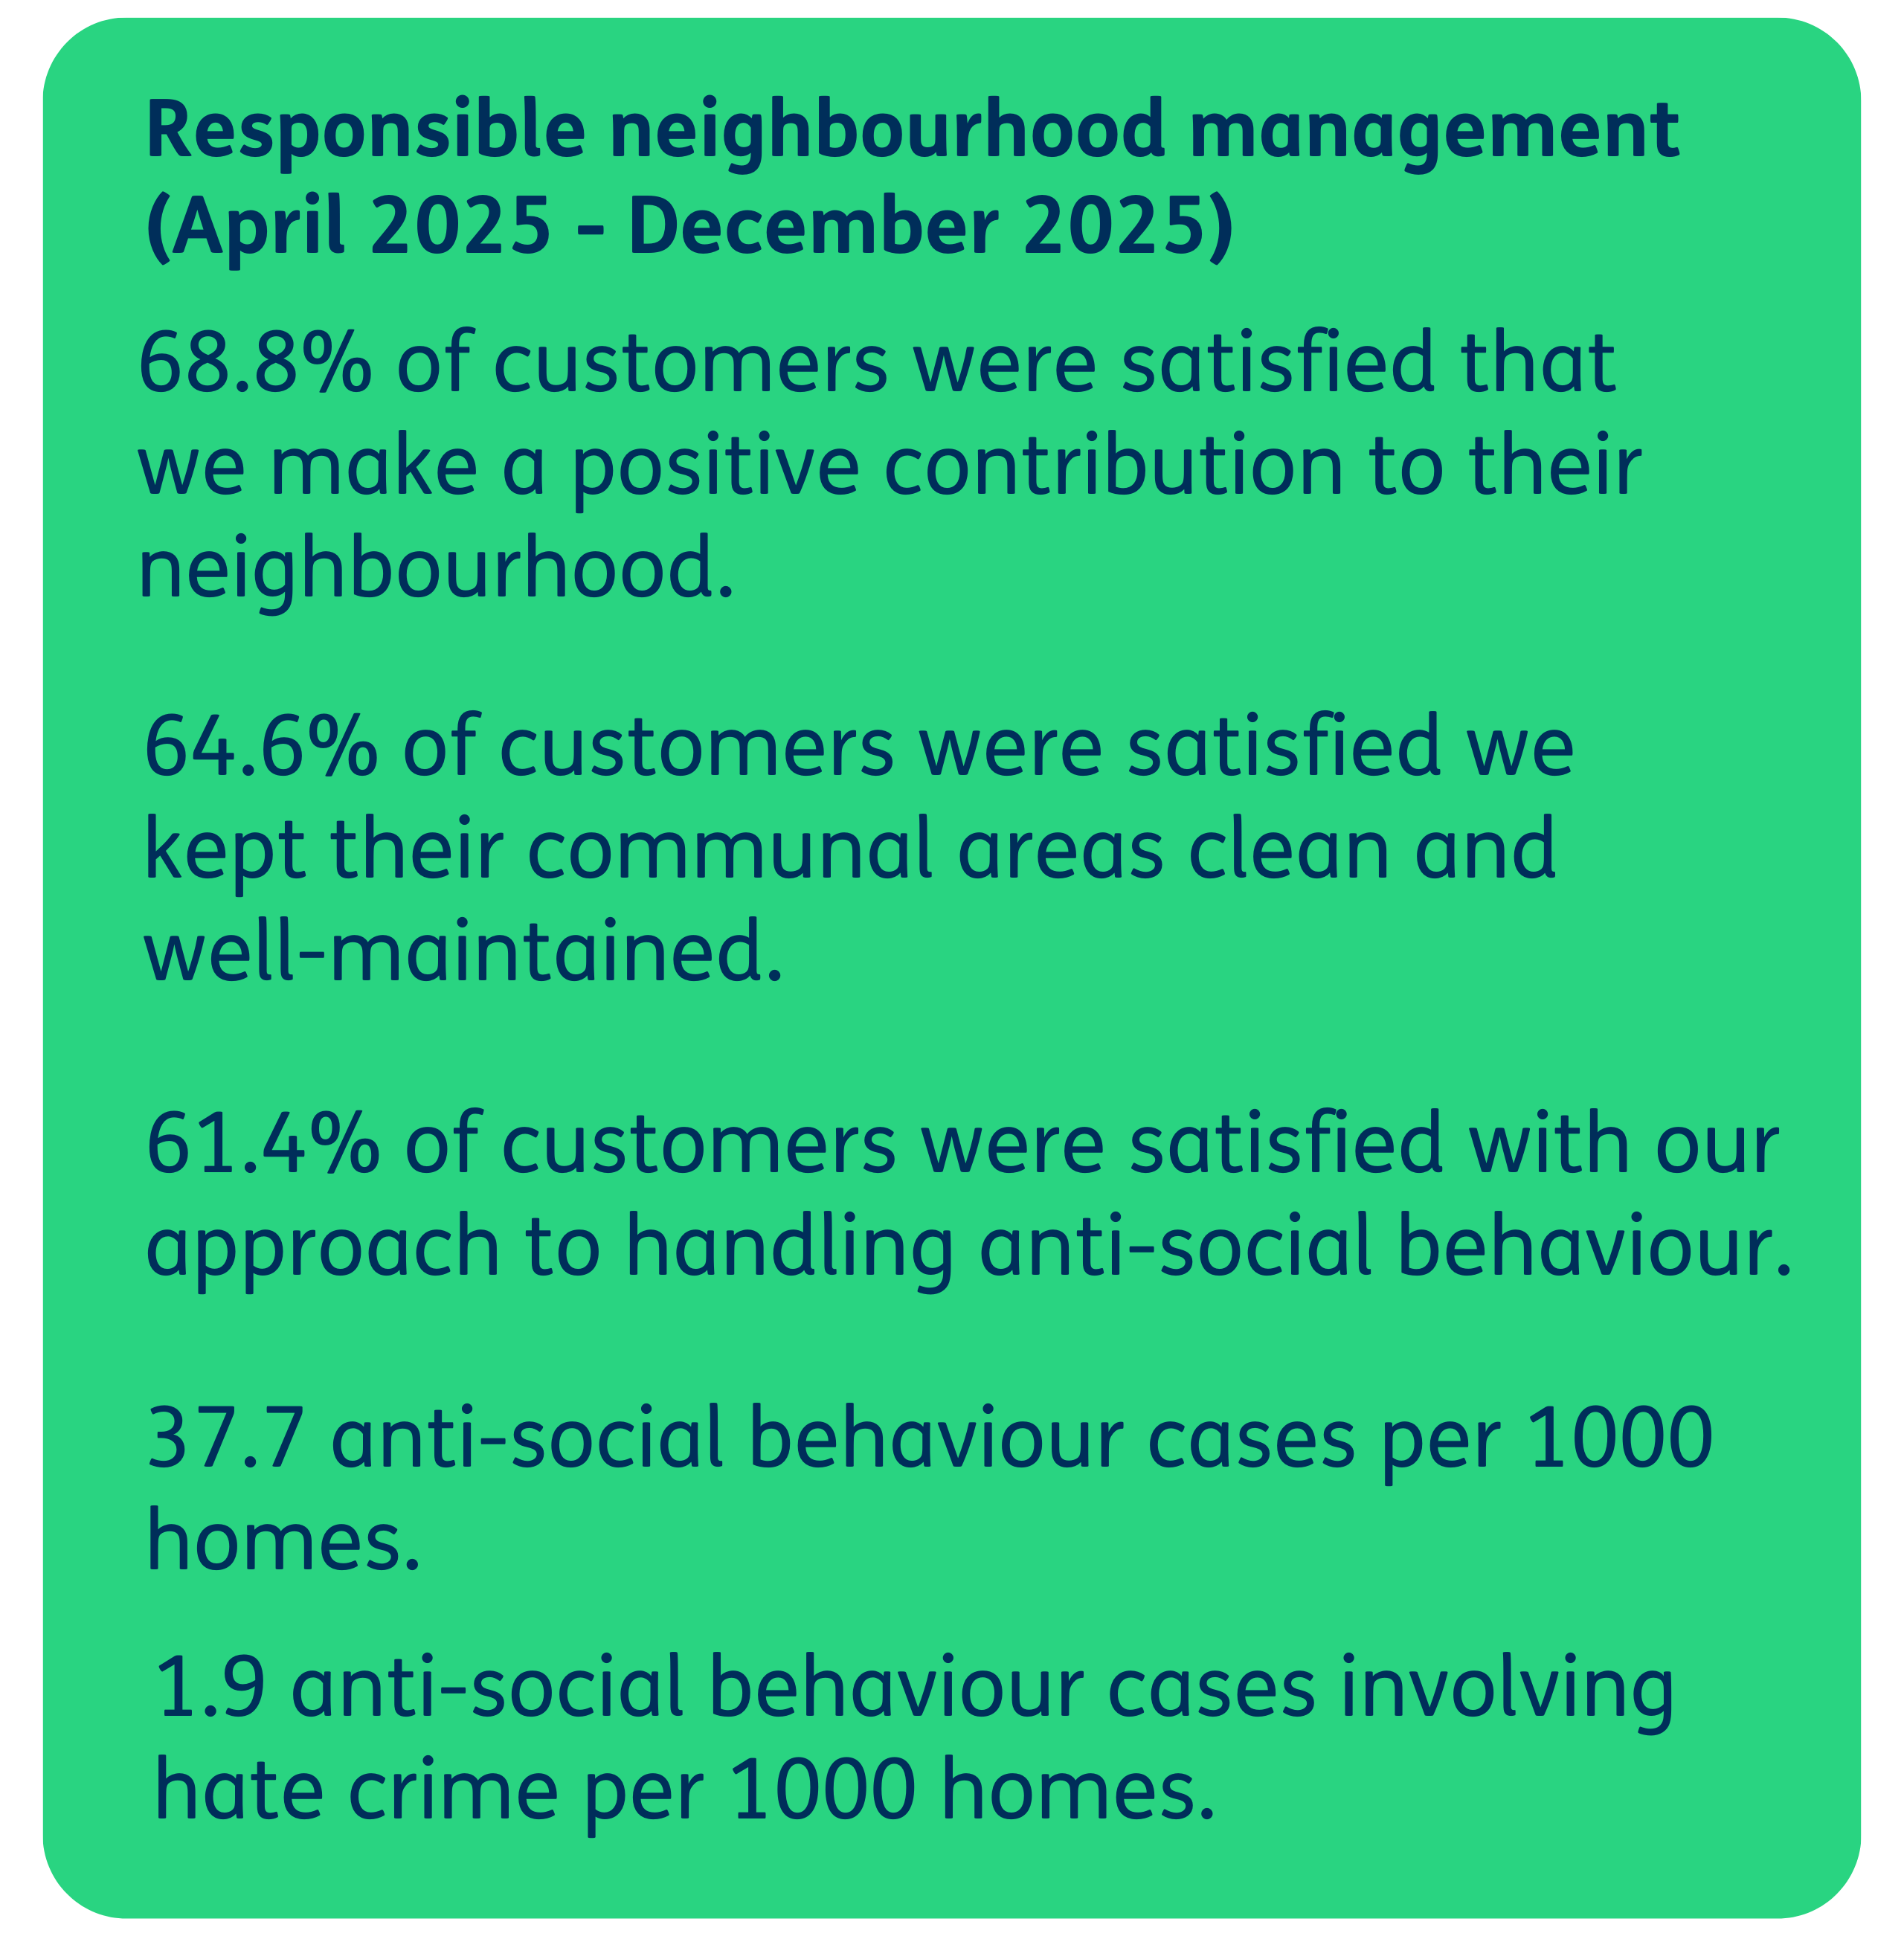
Responsible neighbourhood management


24/25 medians for Private Registered Providers reported by the regulator
You said: Fly-tipping makes neighbourhoods look untidy, causes safety concerns, and affects how it feels to live in your community.
We did: We joined the national Fight Fly-tipping Fortnight campaign to highlight the harm dumped rubbish causes and encourage responsible waste disposal. We shared clear advice and short podcast clips on what fly-tipping is, its impact on people and communities, and how to avoid illegal waste services, supporting our work to keep neighbourhoods clean, safe and well maintained.
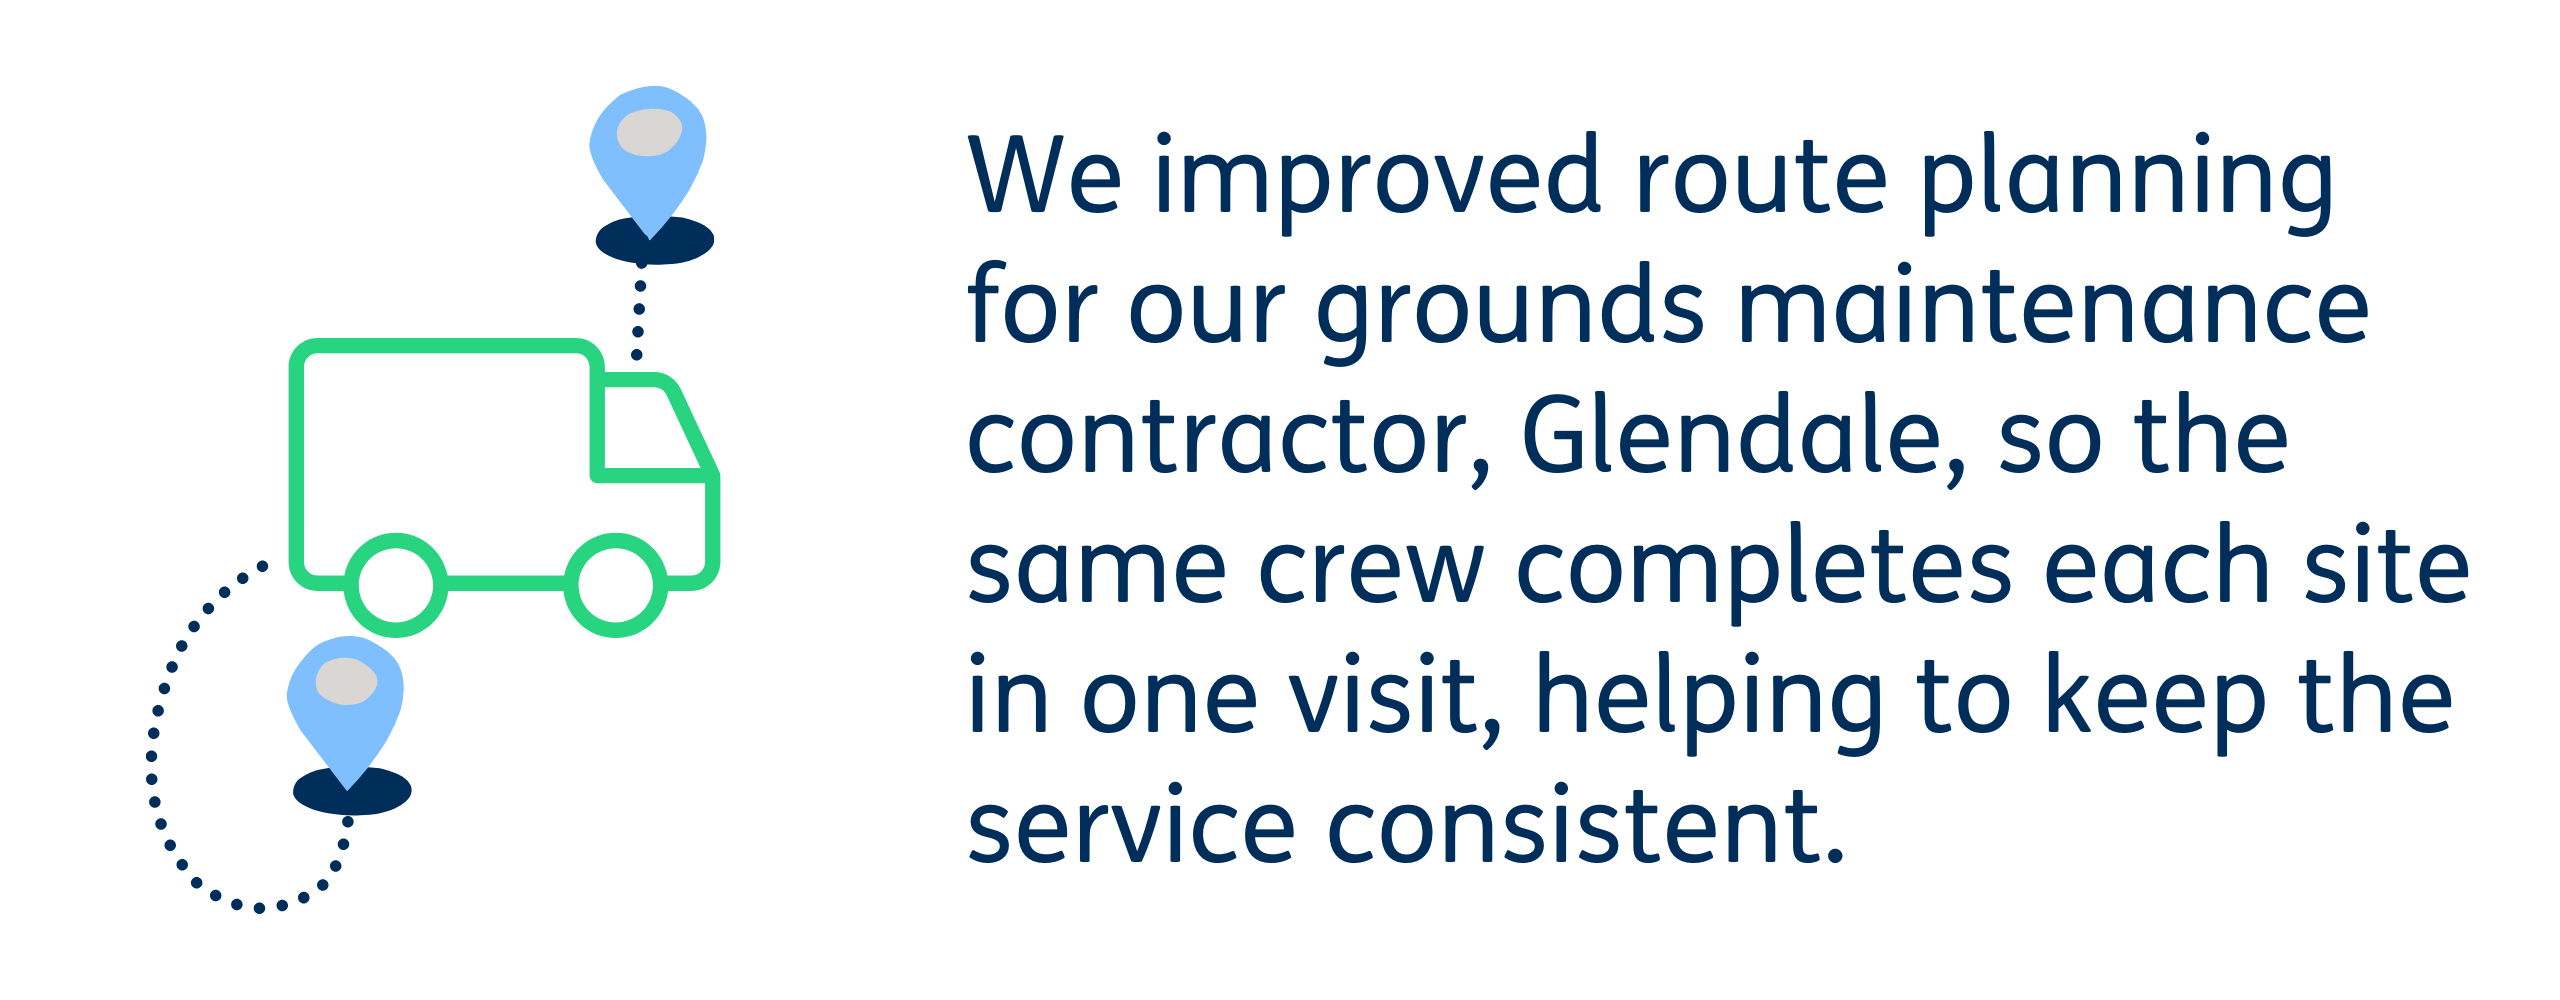
You said: You shared feedback after seeing grounds maintenance completed in one area but not the area next to it, and wanted to understand why this happens.
We did: We reviewed the schedules with our contractor Glendale and changed how routes are planned, so the same crew completes the whole site in one visit. We will continue to check routes and make changes where needed to keep the service consistent.
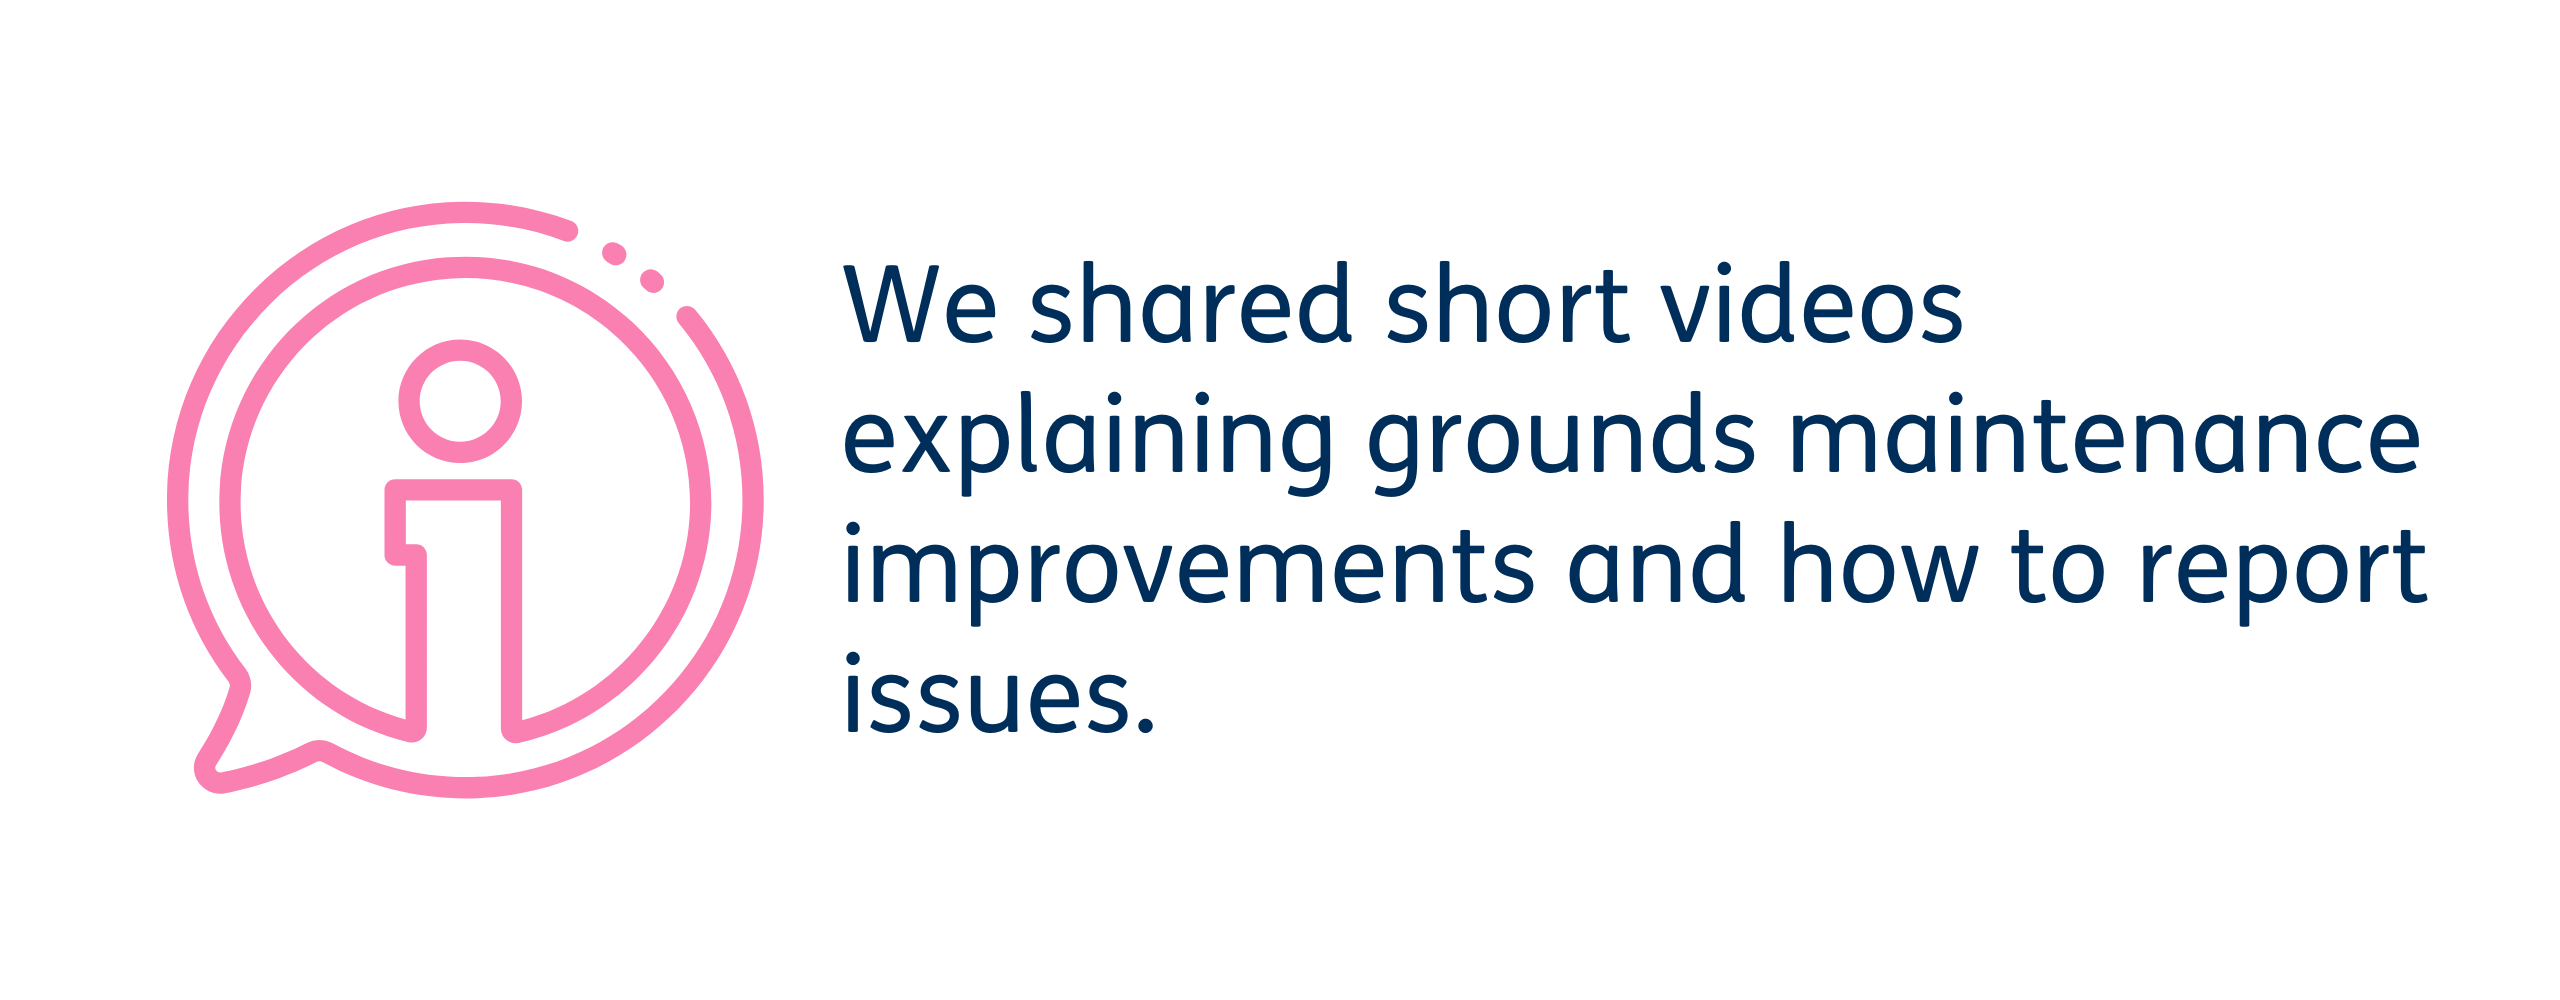
You said: You gave feedback and asked questions about how grounds maintenance works, what’s included at different times of the year, and how to let us know if something does not look right.
We did: We shared a series of short videos where our Neighbourhood Services Manager responds directly to your feedback, explains the improvements we’ve made with our contractor to improve consistency, how the service is checked against agreed standards, and the quickest way to report issues so they can be put right.

"They do a really good job and always clear the mess up." (Comment from our grounds maintenance survey)
Respectful and helpful engagement


24/25 medians for Private Registered Providers reported by the regulator
You said: You shared your views and asked for clearer information about how grounds maintenance works, what to expect at different times of the year, and how to raise an issue if something does not look right.
We did: We shared short videos where our Neighbourhood Services Manager responds directly to your feedback, explains the changes we’ve made to improve consistency, and clearly sets out how to report issues so they can be put right.
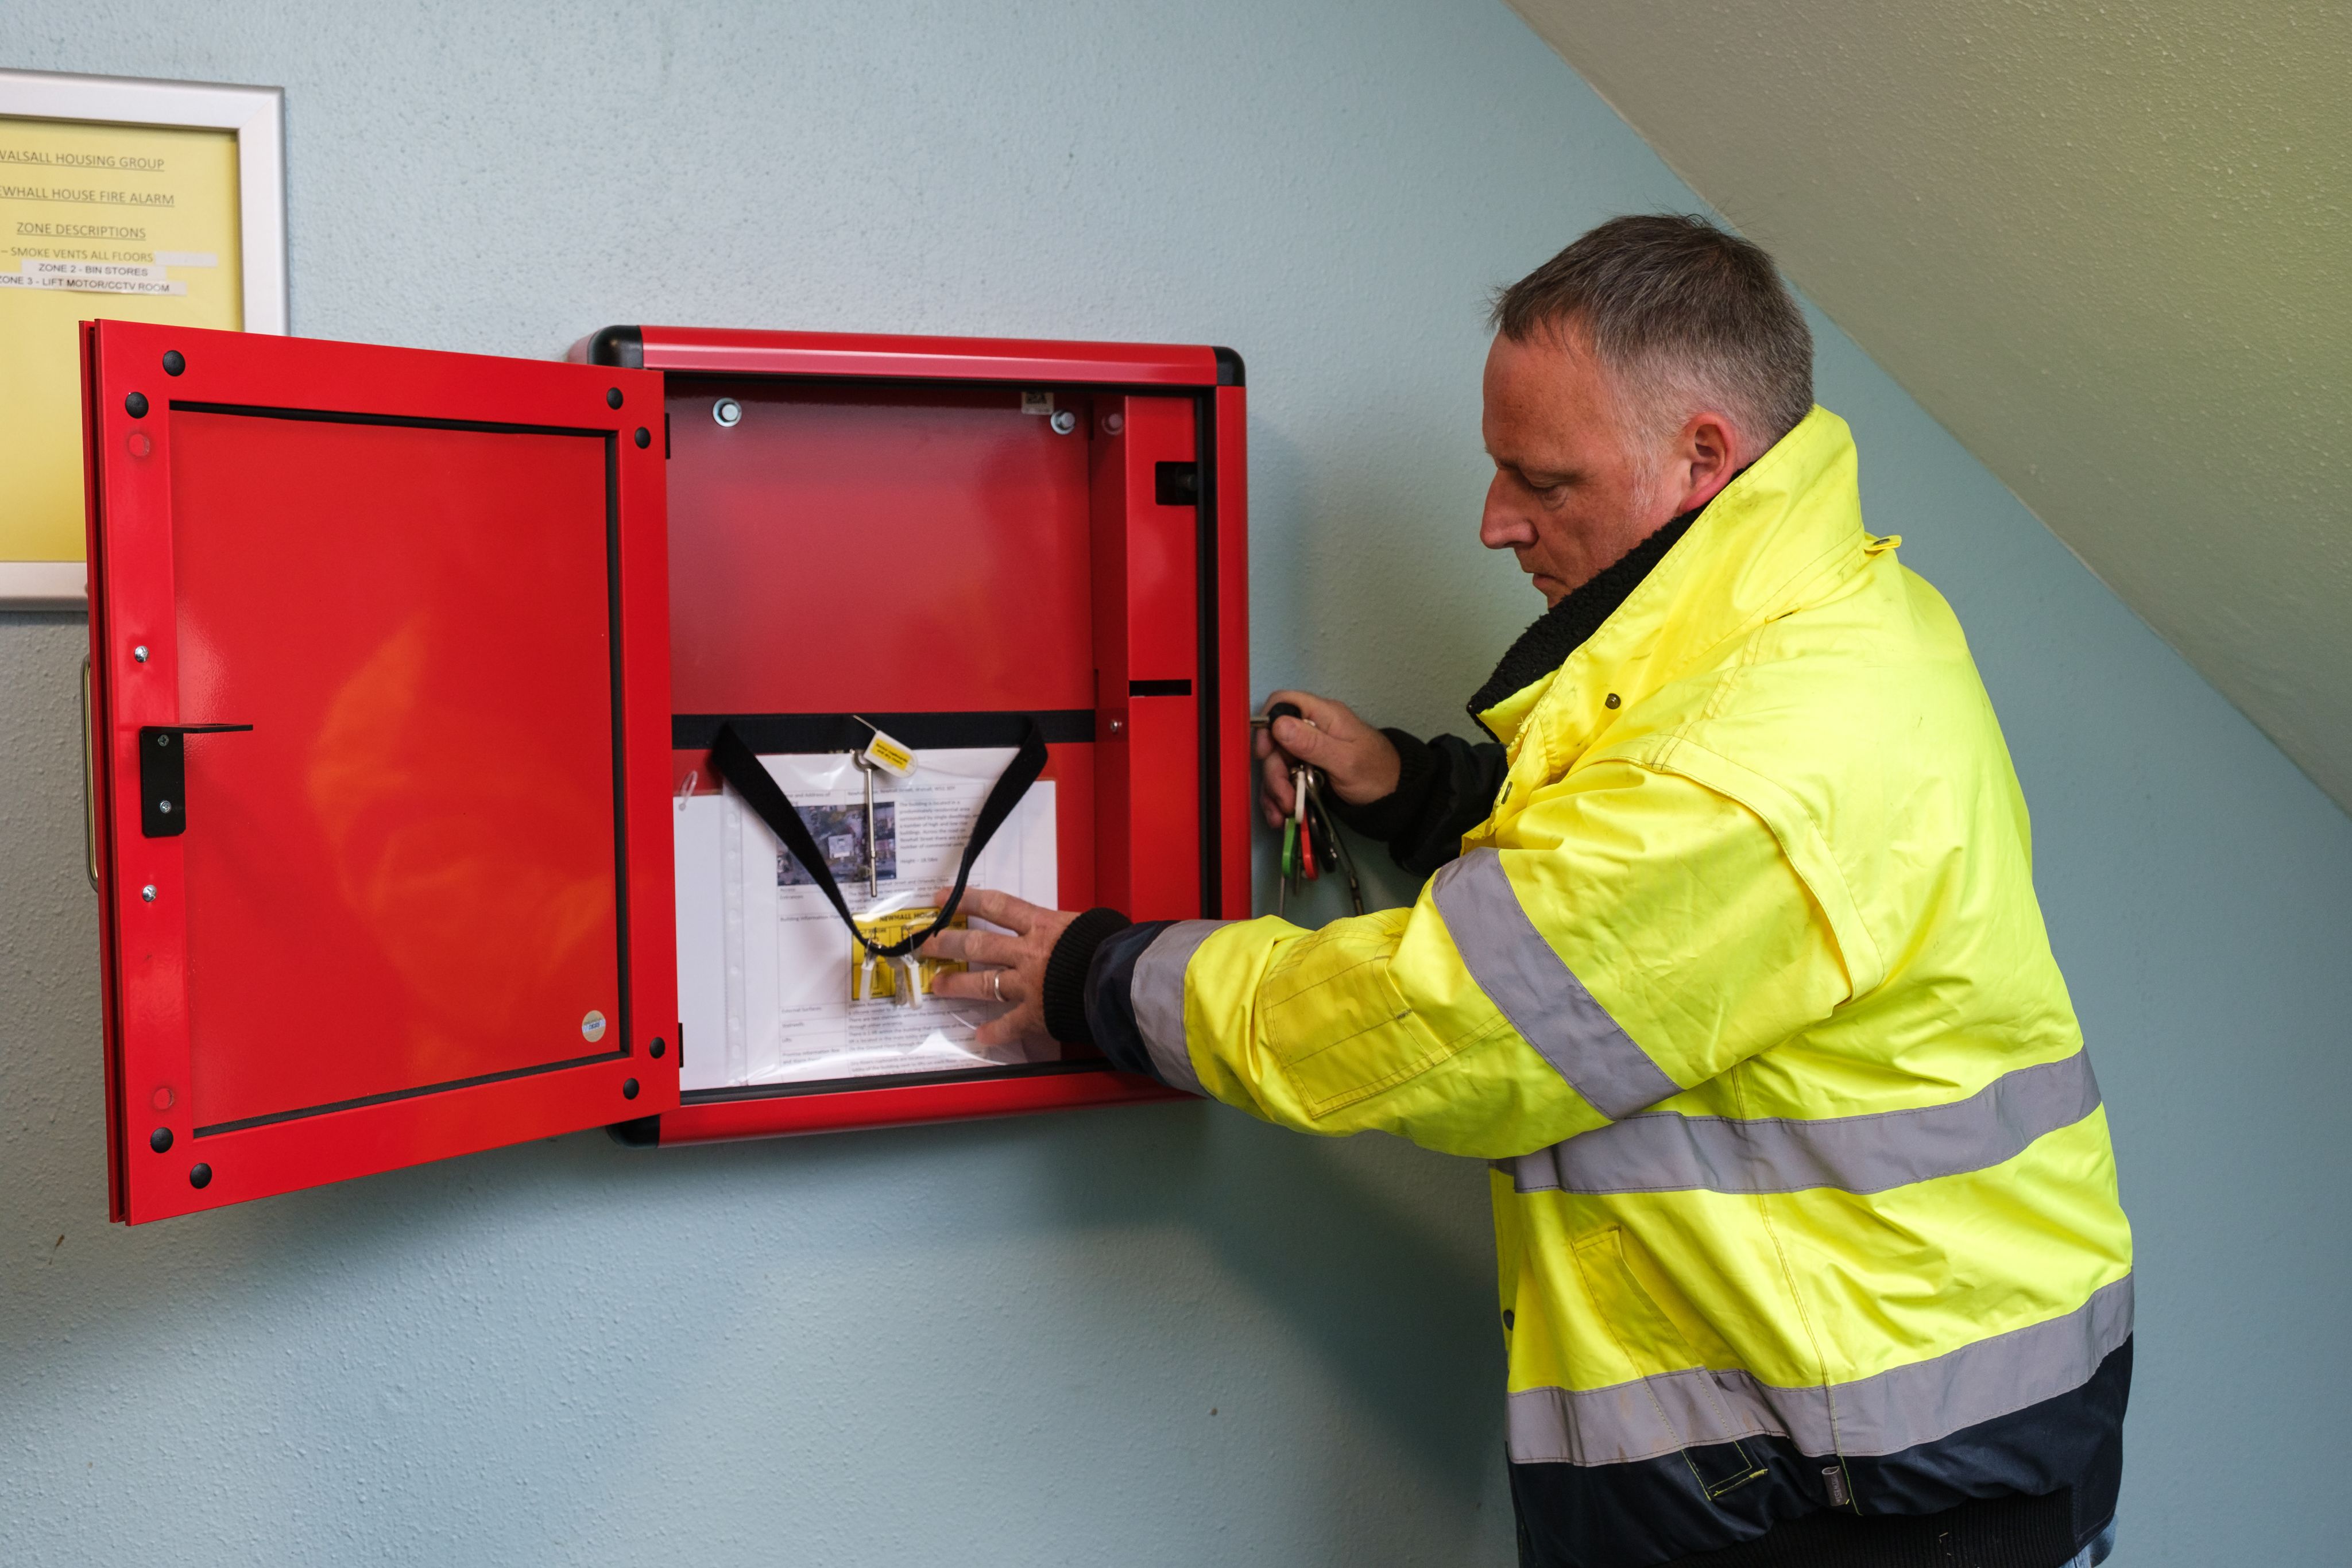
Maintaining building safety


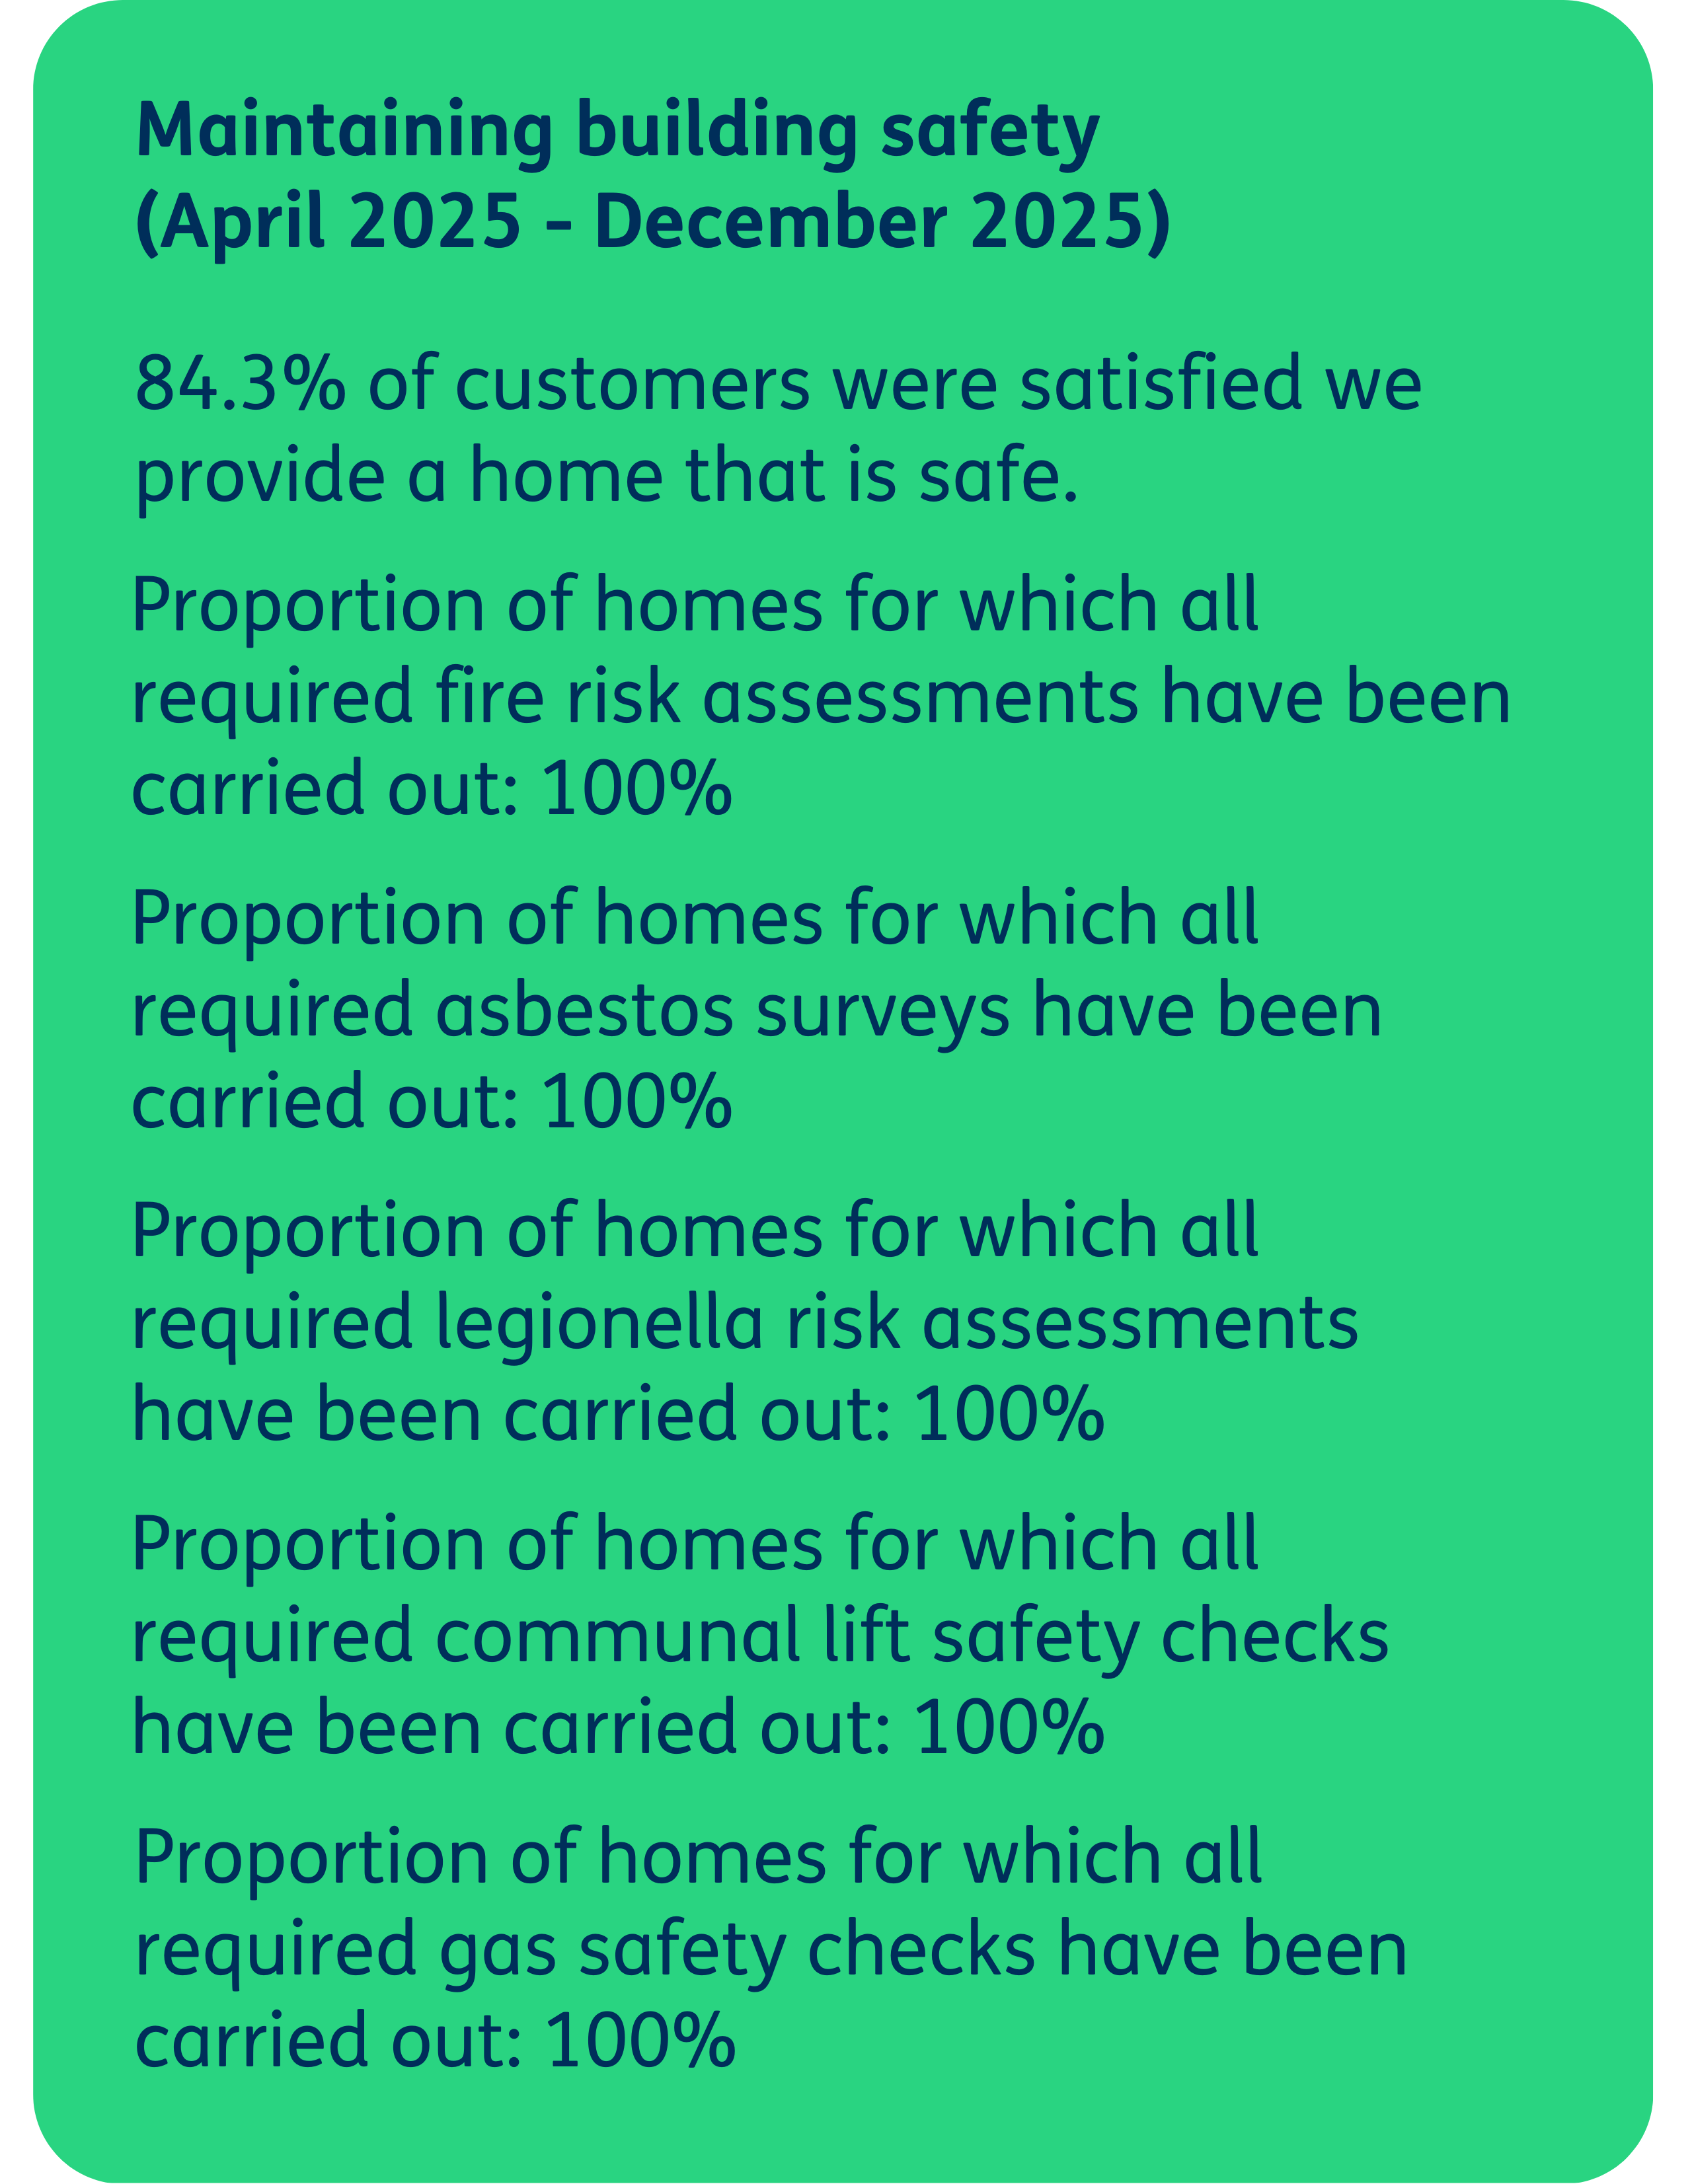
24/25 medians for Private Registered Providers reported by the regulator
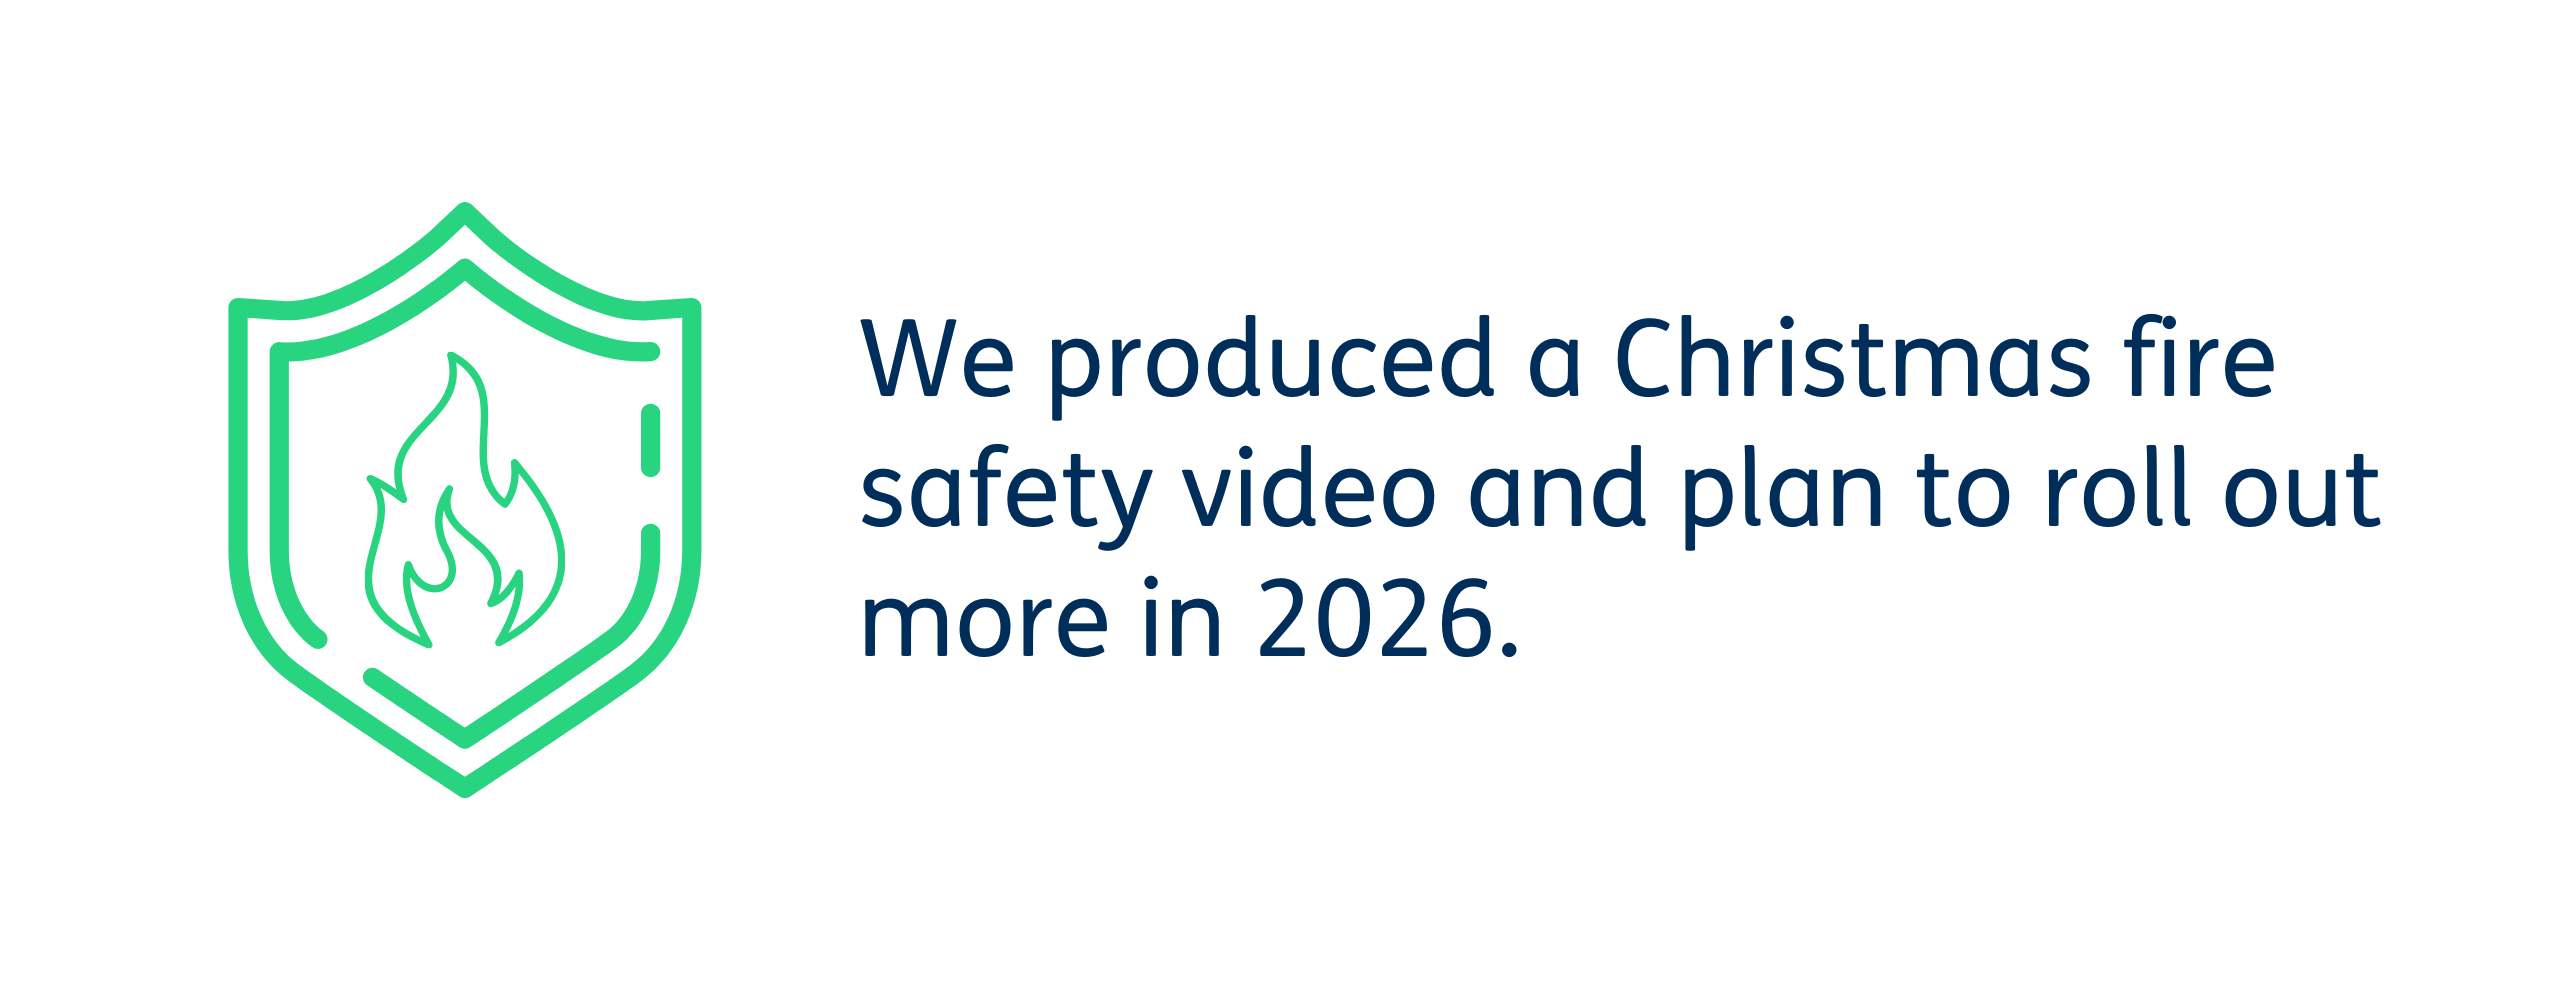
You said: At the annual customer conference, you asked us about seasonal fire safety messages and risks.
We did: We produced a Christmas fire safety video and are looking at rolling out more in 2026.
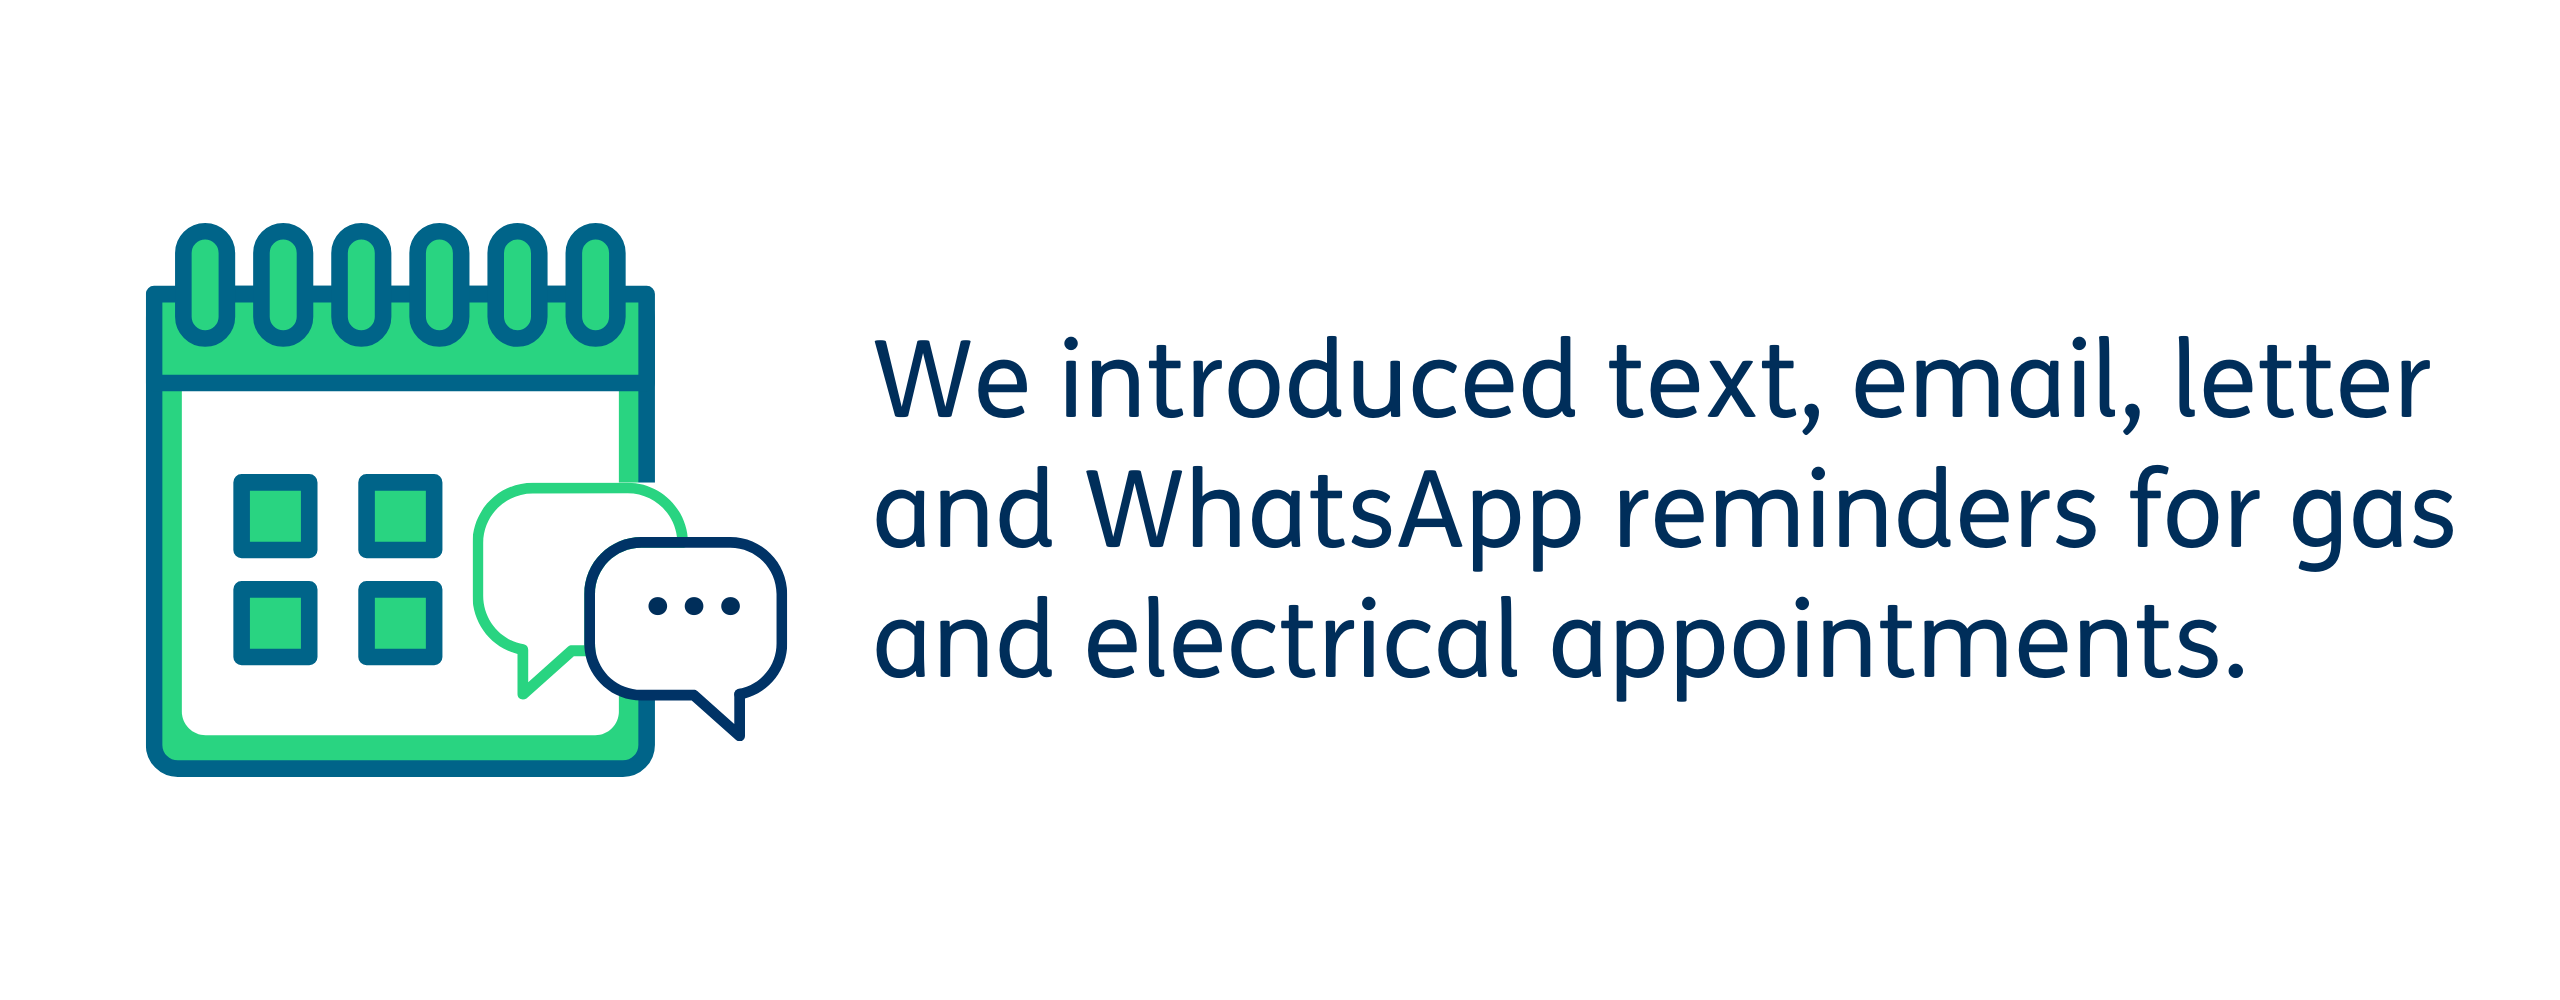
You said: You aren’t always aware of when your gas or electrical check appointment is taking place.
We said: We have introduced a range of ways to let you know about your upcoming gas or electrical appointment, including by text, email, letter and WhatsApp
Effective handling of complaints


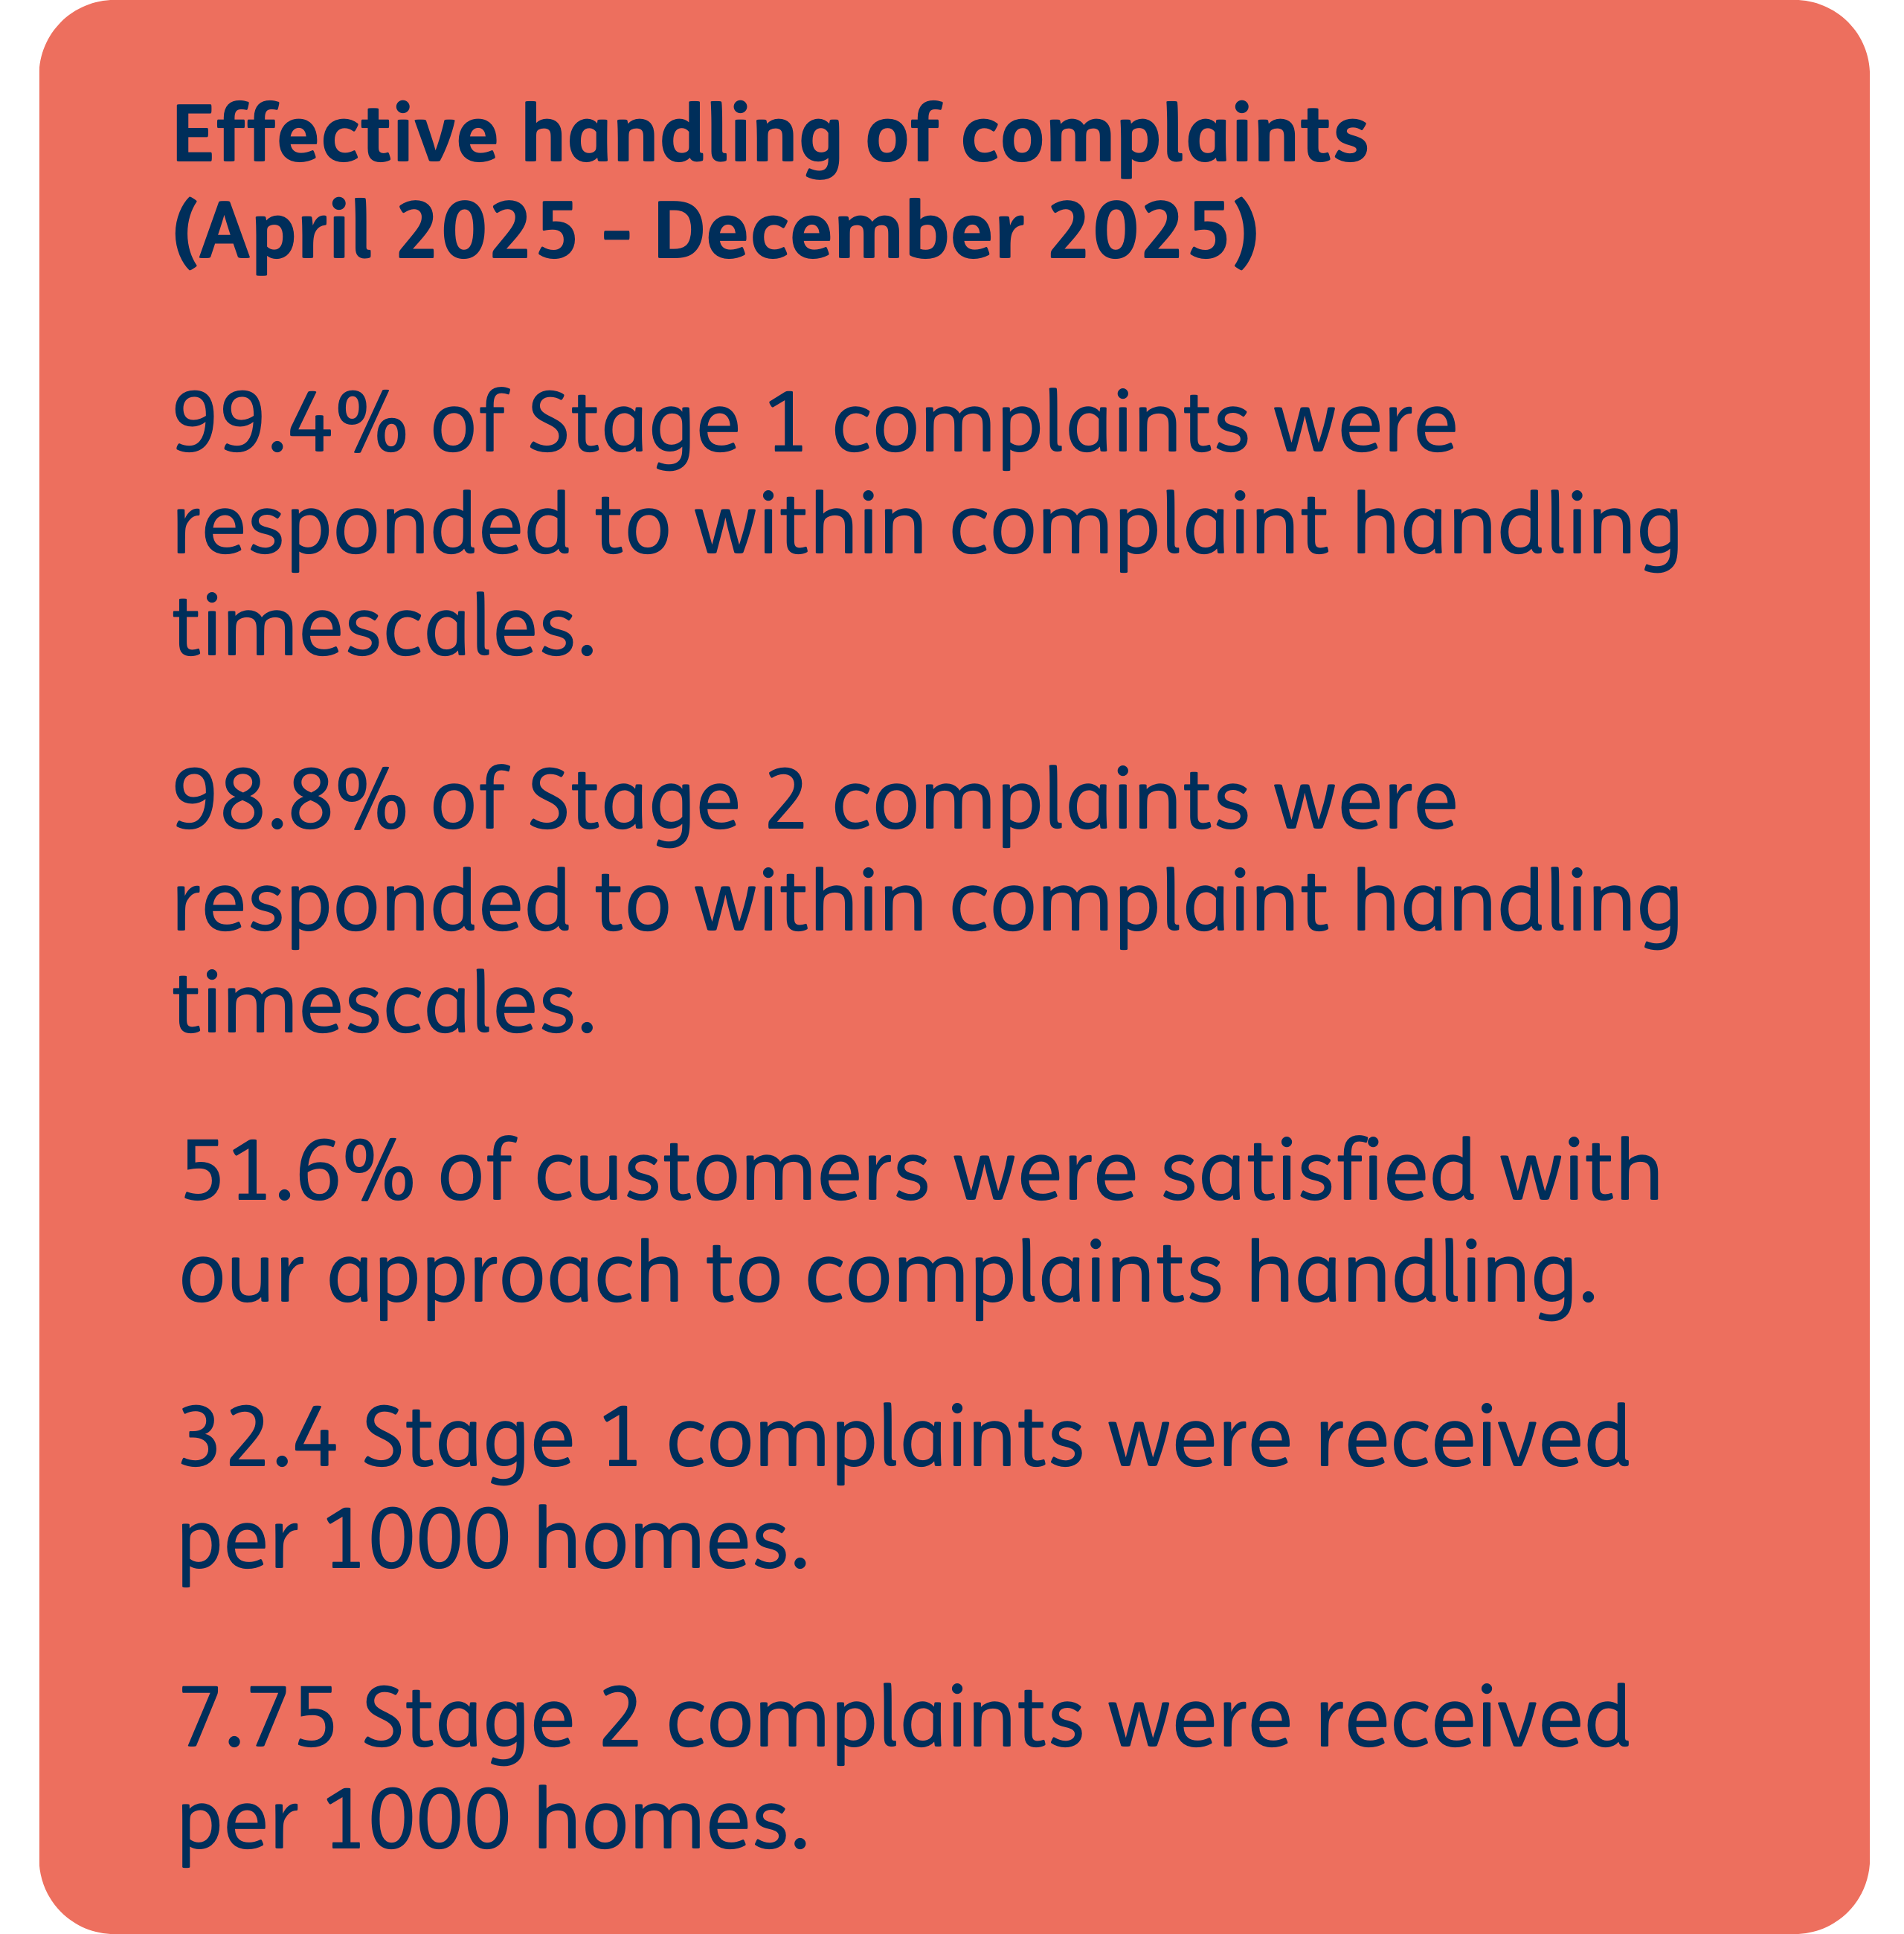
24/25 medians for Private Registered Providers reported by the regulator
We work with customers like you to improve our complaints service. Your feedback has led to important changes.
You can read about this in our Complaints Action Plan.
How we measure customer satisfaction
We measure our performance against Tenant Satisfaction Measures (TSMs).
TSMs have been introduced by the Regulator of Social Housing to assess how well housing providers like us are doing at providing good quality homes and services. They show you how we compare to other social landlords and also help us understand where we need to improve.
We measure our performance against these TSMs by carrying out surveys with customers and asking you how you feel about us as a landlord. The results are sent to the regulator who publishes all the results in Autumn.
We will also share the results here every three months so you know how we are doing.

About our TSM Survey
We received 925 survey responses from customers in Low Cost Rental Accommodation (LCRA) and shared owners, otherwise known as Low Cost Home Ownership (LCHO) between April 2025 and December 2025.
The number of surveys is linked to the number of homes we own, and help ensure the results are reliable and accurate. Following official guidelines, we don’t currently include Low Cost Home Ownership (LCHO) customers in the data we send to the Regulator of Social Housing, but we include them here because its important to understand the experience of both customer types.
We ensure our survey sample represents our customer base by including feedback from customers across different property types, areas, ages, ethnicities and genders.
We appointed an independent consultancy, IFF Research, to collect and analyse our TSM responses.
IFF conducted 100% of the surveys by phone.

How helpful was this report?
Let us know if this report was helpful and we'll keep doing more (or less) of the same to keep you updated about our TSM scores.